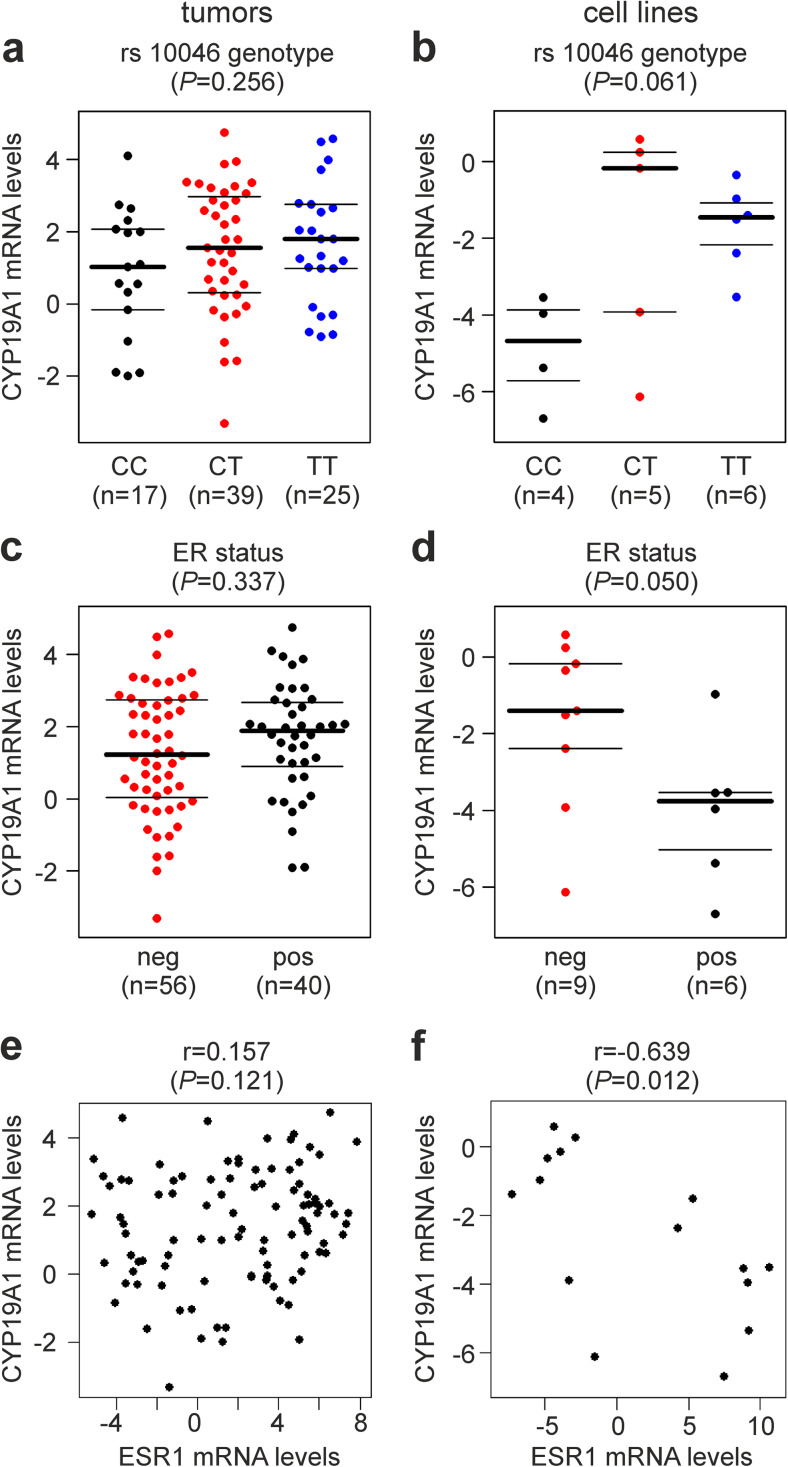
Fig. 1.
Association of CYP19A1 mRNA expression with a, b rs10046 SNP genotype, c, d ER (estrogen receptor) status, and e, f ESR1 (estrogen receptor 1) mRNA expression. Analyses are in human primary breast tumors (a, c, e) and in human breast cancer cell lines (b, d, f). CC, CT, and TT are the genotypes of SNP rs10046. The numbers of patients and cell lines in each group (n) are shown in parentheses. The y-axes in a–f show normalized relative CYP19A1 mRNA levels (log(2) values). P values (P, in parentheses above each panel) were determined by a, b ANOVA, c, d unpaired, two-sided t tests, and e, f Spearman’s rank correlation. r, Spearman’s rho (rank correlation coefficient)

