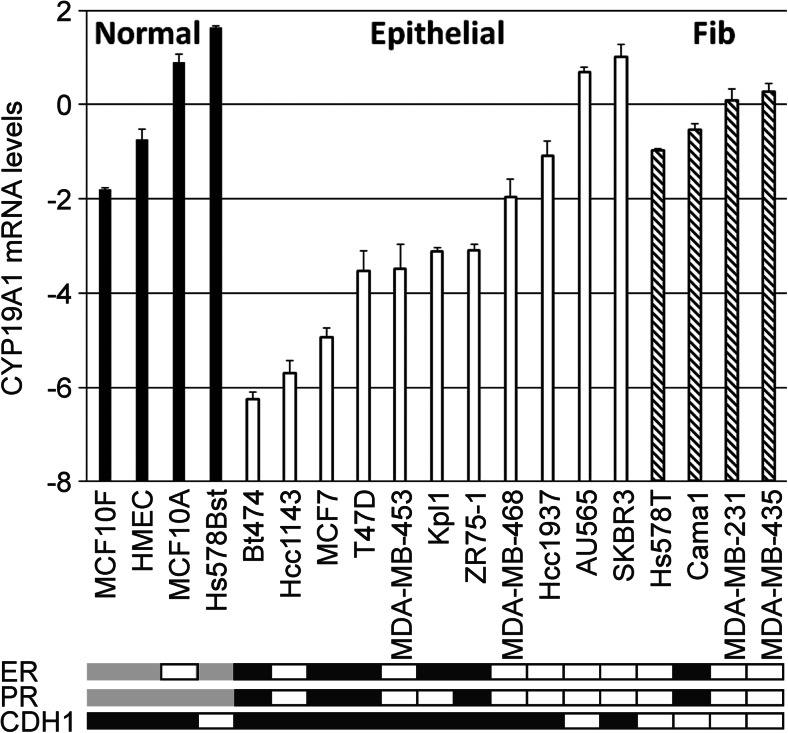
Fig. 2.
CYP19A1 mRNA expression in human untransformed breast epithelial and breast cancer cell lines. The y-axis shows mean relative CYP19A1 mRNA levels (log(2) values) of duplicate measurements. Expression levels of the indicated individual untransformed cells (Normal, black bars), breast cancer cell lines with an epithelial morphology (Epithelial, white bars), and breast cancer cell lines with a fibroblastoid morphology in culture (Fib, hatched bars) are shown. For normalization, the mean expression level of the four untransformed cell lines was set to unity (i.e., 20 in graph), and the levels of individual cell lines are presented relative to those. Boxes underneath the bar graph indicate a positive (black) or negative (white) status of ER, PR, and CDH1 (E-cadherin). ER and PR status are based on [45, 46], and CDH1 status is based on determination of mRNA levels by qRT-PCR. Gray, status not available

