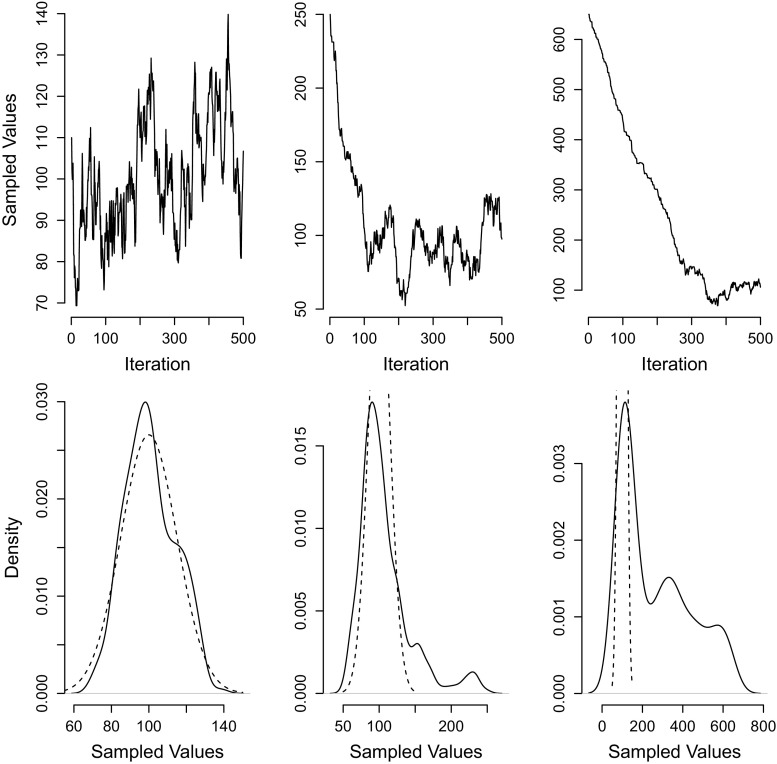
Fig. 1.
A simple example of MCMC. Left column: A sampling chain starting from a good starting value, the mode of the true distribution. Middle column: A sampling chain starting from a starting value in the tails of the true distribution. Right column: A sampling chain starting from a value far from the true distribution. Top row: Markov chain. Bottom row: sample density. The analytical (true) distribution is indicated by the dashed line

