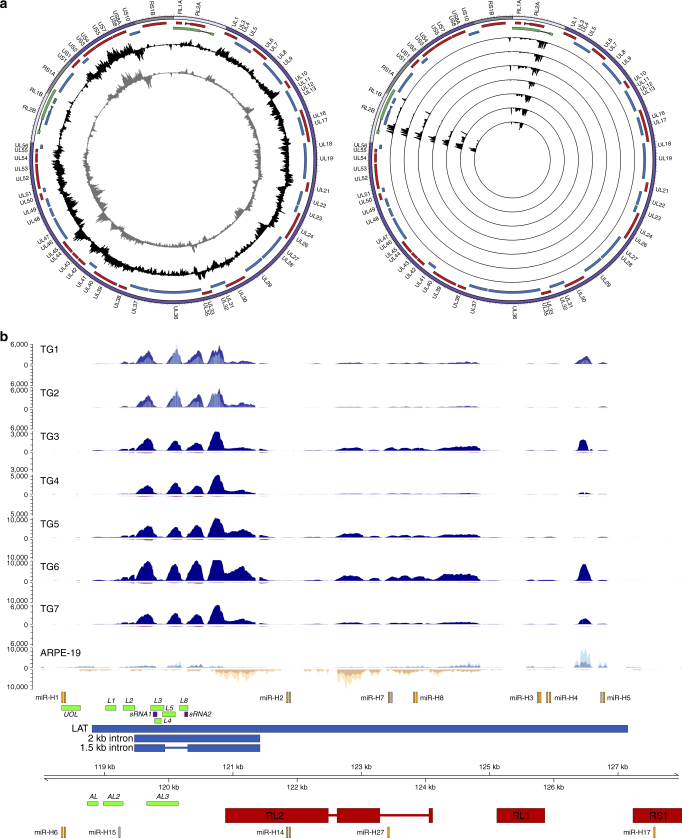
Fig. 1.
HSV-1 transcriptome profile during lytic and latent infection. Strand-specific mRNA-seq of lytically HSV-1-infected ARPE-19 cells and seven latently HSV-1-infected human trigeminal ganglia (TG) (Supplementary Table 1). a Circos plots of the HSV-1 genome [purple band; sense and antisense open reading frames (ORFs) indicated as blue and red blocks, respectively], the latency associated transcripts (LATs) indicated as green blocks, with internal tracks revealing the lytic (left) and latent (right) transcriptomes using unenriched (grey tracks) and HSV-1-enriched (black tracks) libraries. Lytic transcriptomes were profiled using HSV-1-infected ARPE-19 cells. Latent HSV-1 transcriptomes are profiled from seven TGs, with each track depicting a single specimen. Peaks facing outward from the centre indicate reads mapping to the sense strand, while peaks facing inward originate from the antisense strand. The y axis is scaled to maximum read depth per library in all cases. b Linear representation of the HSV-1 LAT genomic region (green blocks in a), with blue and yellow tracks depicting HSV-1-enriched mRNA-Seq reads originating from the sense and antisense strand, respectively. Unenriched mRNA-Seq tracks for ARPE-19 cells, and TGs 1 and 2, are superimposed and shown in light blue (sense) or yellow (antisense), with overlapping regions in medium-blue and orange, respectively. HSV-1 genome coordinates are shown the HSV-1 reference strain 17 (NC_001806.2); Previously described HSV-1 ORFs within this locus (red boxes), miRNAs (orange blocks), LAT-encoded ORFs (green blocks), LAT-encoded small RNAs (dark red blocks) and LAT (blue boxes) are scaled representatively. . Paired-end read data sets were generated with read lengths of 2 × 34 bp (ARPE-19) or 2 × 76 bp (TG1 and TG2) or 2 × 151 bp (TG3–TG7)

