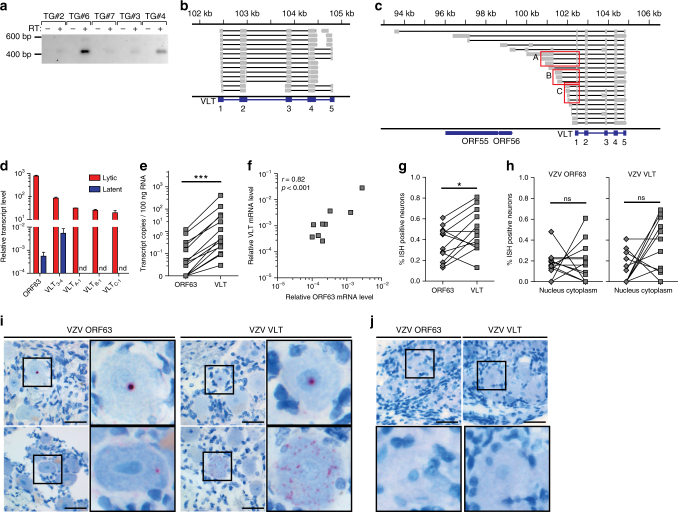
Fig. 4.
Prevalence of VLT and ORF63 transcript in human TG. a PCR amplification of cDNA (n = 5 TGs, Supplementary Table 1), synthesized in the presence (+) or absence (−) of reverse transcriptase. Sanger sequencing of all five purified PCR products yielded identical sequences corresponding to VLT (Fig. 3b). b Integrative Genomics Viewer (IGV) screenshot showing representative RNA-Seq data from a single TG. Paired-end reads are shown as fragments mapped across the VLT locus. Grey boxes (exons) connected by black lines (introns) indicate individual read pairs with distinct read-pairs separated by white space. Each fragment spans between 2 and 5 exons and there was no evidence of additional upstream exons. c In lytically VZV-infected MeWo cells, Sanger sequencing of amplicons generated through rapid amplification of cDNA ends revealed multiple VLTly isoforms, visualized using IGV. Sequencing of 29 clones identified the three most abundant VLTly isoform groups (red boxes) A (35%), B (19%) and C (15%). Note that the specific VLT isoform observed in latently infected TG was not observed among VLTly isoforms. d Quantification of ORF63 transcript and VLT isoforms in lytically VZV-infected ARPE-19 cells (red; n = 3) and latently VZV-infected TG (blue; n = 19 TG), using primers/probes spanning VLT splice junctions between exons 3→4, A→1, B→1 and C→1 (Fig. 4c and Supplementary Table 5). Data represent mean (±SEM) relative transcript levels normalized to β-actin RNA. nd not detected. e Levels of paired ORF63 transcript and VLT (primers/probe spanning exon 2→3) in the same VZVPOS TG (VZVPOS; n = 15) determined by RT-qPCR. ***p < 0.001; Wilcoxon signed rank test. f Correlations (Spearman) between relative ORF63 transcript and VLT levels in VZVPOS TG (n = 15), as determined by RT-qPCR. g–j In situ hybridization (ISH; red signal) analysis of ORF63 RNA and VLT in latently VZV-infected TG (n = 12). g Frequency of neurons positive for ORF63 RNA and VLT in consecutive TG sections of the same donor. *p < 0.05; paired Student’s t-test. h Nuclear and cytoplasmic ORF63 RNA and VLT expression in consecutive TG sections from individual donors. ns not significant; paired Student's t-test. i, j Representative ISH images of VZVPOS TG sections (i) and two VZV naive human fetal dorsal root ganglia (j). Nuclei were stained with haematoxylin. Magnification: ×400 (with 3× digital zoom for insets). Bars = 50 µm

