Fig. 5.
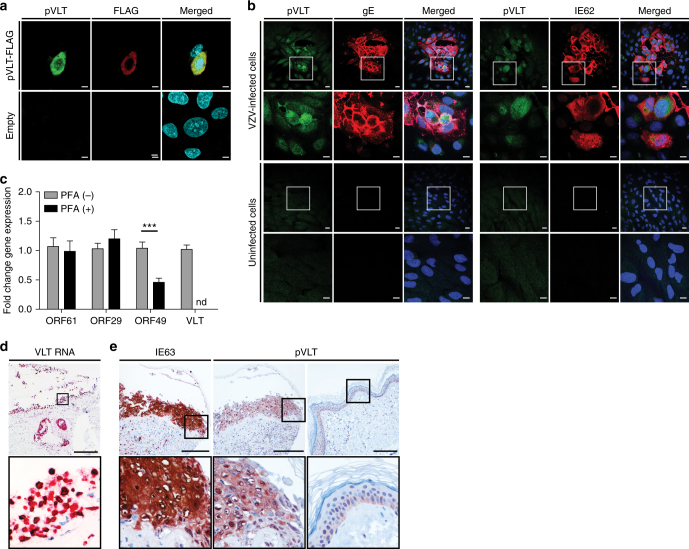
Expression of VLT protein in vitro and in situ. a Representative confocal microscopic image of ARPE-19 cells at 48 h post-transfection with C-terminal FLAG-tagged VLT (pVLT-FLAG) expression plasmid or empty control plasmid (empty). pVLT-FLAG was detected with antibodies directed to FLAG (red) and VLT protein (pVLT; green). Magnification: ×1000 and ×2 digital zoom. Bars = 5 µm. b Representative confocal microscopic images of uninfected and VZV strain EMC1-infected ARPE-19 cells at 2 days post-infection, stained for both pVLT (green) and VZV glycoprotein E (gE; red) (left panel) or pVLT (green) combined with VZV ORF62 protein (IE62; red) (right panel). Magnification: ×200, with area indicated by the white box shown at ×600. Bars = 20 µm (×200) and 10 µm (×600). In a, b, nuclei were stained with Hoechst 33342 (cyan) and images are representative of results from four independent experiments. c RT-qPCR quantitation of VZV ORF61, ORF29 and ORF49 transcript and VLT levels in VZV pOka-infected ARPE-19 cells cultured with (PFA+) and without phosphonoformic acid (PFA−) for 24 h. Data represent mean (±SEM) fold-change in gene expression, using the respective ‘PFA−' value as a calibrator, from four independent experiments. ***p < 0.001; Wilcoxon signed rank test. d Detection of VLT (red) in a human herpes zoster (HZ) skin lesion by in situ hybridization. Magnification: ×100. Inset: ×400 and 2× digital zoom. Bar = 200 µm. e Consecutive HZ skin sections stained immunohistochemically for ORF63 protein (IE63; brown) and pVLT (brown) (left and middle panels) and sections from unaffected control skin stained for pVLT (right panel). Magnification: ×200. Inset: ×400. Bars = 100 µm. Images in d, e are representative of five HZ skin biopsies stained

