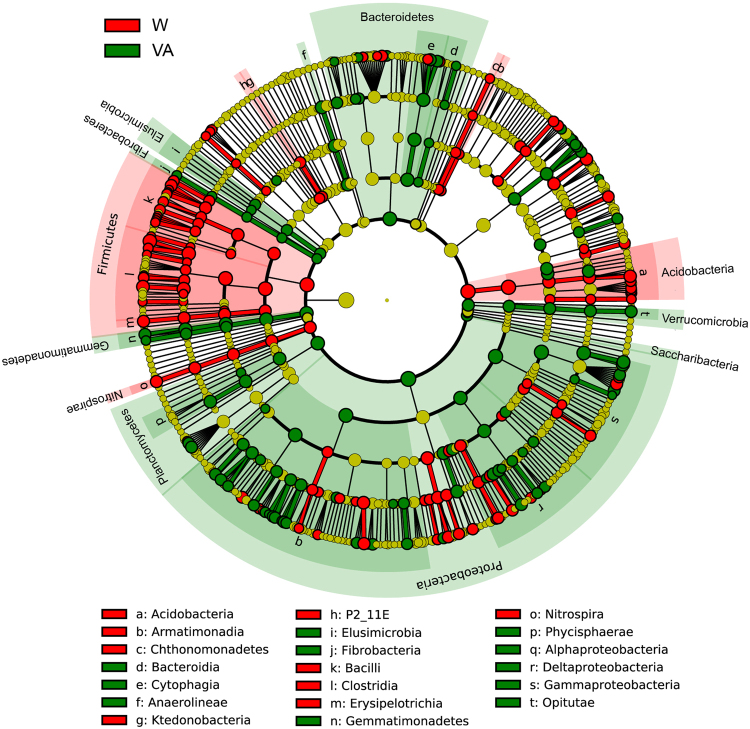
Figure 2.
Cladograms, generated from LEfSe analysis, represent the polygenetic distribution of cucumber rhizosphere soil bacterial taxa. LEfSe analysis was based on the data of three independent replicates of each treatment. Bacterial taxa that are significantly enriched in each treatment with LDA scores larger than 2.0 are shown. Significantly discriminant taxon nodes are colored: red for cucumber rhizosphere soils treated with water (W), green for vanillic acid at 0.05 μmol g−1 soil (VA). Yellow circles represent non-significant differences in abundance between treatments for that particular taxon. Each circle’s diameter is proportional to the taxon’s abundance. Labels are shown of the phylum, class and order levels. The LDA scores of each significantly discriminant taxon from the phylum to genus levels are shown in Figure S2.

