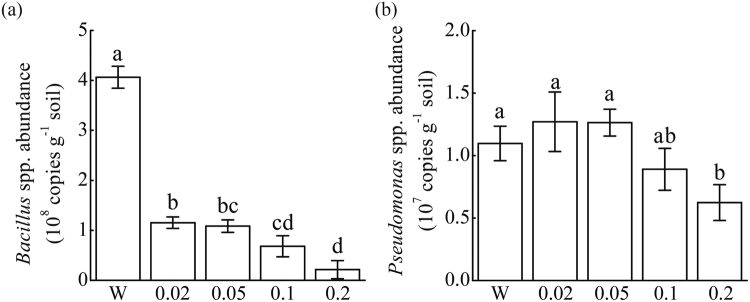
Figure 6.
Abundances of Bacillus (a) and Pseudomonas (b) spp. communities in cucumber rhizosphere soils as determined by quantitative PCR. W represents cucumber rhizosphere soils treated with water. 0.02, 0.05, 0.1 and 0.2 represent cucumber rhizosphere soils treated with vanillic acid at 0.02, 0.05, 0.1, 0.2 μmol g−1 soil concentrations, respectively. Data are represented as the means of three independent replicates with standard error bars. Different letters indicate significant difference based on Tukey’s HSD test test (P < 0.05).

