Fig. 6.
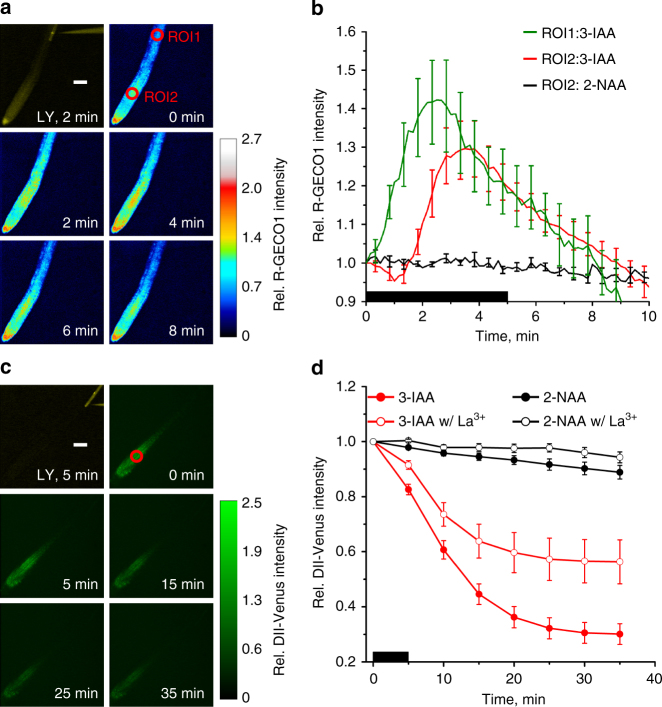
Long-distance Ca2+- and IAA-signaling. a Fluorescence image of a single root-hair cell stimulated by intracellular application of IAA and LY, over a period of 5 min. All other panels, false color images indicating changes in R-GECO1 intensity, normalized to the average value at ROI2 at the start of IAA-injection (indicated by the color bar on the left). The time after the start of the experiment is given. Representative for 8 measurements. The scale bar represents 100 µm. b Changes in R-GECO1 signal intensity, plotted against time, in ROI1 (green line) and ROI2 (red line) of root stimulated with 3-IAA, or in ROI1 of root stimulated with 2-NAA (black line). Data are presented relative to the average fluorescence intensity in ROI of interest, at the start of injection. Black bar indicates the period of IAA injection into a root epidermal cell in close proximity to ROI1. Average values are shown (n = 8 ± s.e.m. for IAA and n = 8 ± s.e.m. for 2-NAA). c Fluorescence image of a single root-hair cell stimulated by 5 min intracellular application of IAA and LY. All other panels, changes in fluorescence intensity of the auxin-signaling sensor DII-Venus triggered by cytosolic application of IAA, bar on the right indicates fluorescence intensities relative to the average intensity of the ROI at the start of the experiment. Representative for 14 experiments. The scale bar represents 100 µm. d Changes in DII-Venus signal intensity, relative to the start of the experiment. Single root epidermal cells were stimulated with 2-NAA (black curves), or 3-IAA (red curves), in the presence (open circles) or absence (closed circles) of 128 µM La3+ in the bath. Data were obtained from ROI at ~400 µm distance, towards the root tip, from the stimulated root epidermal cell (red circles in a and c). Average values are shown (n = 14 ± s.e.m. w/o La3+ and n = 6 ± s.e.m. w/La3+)

