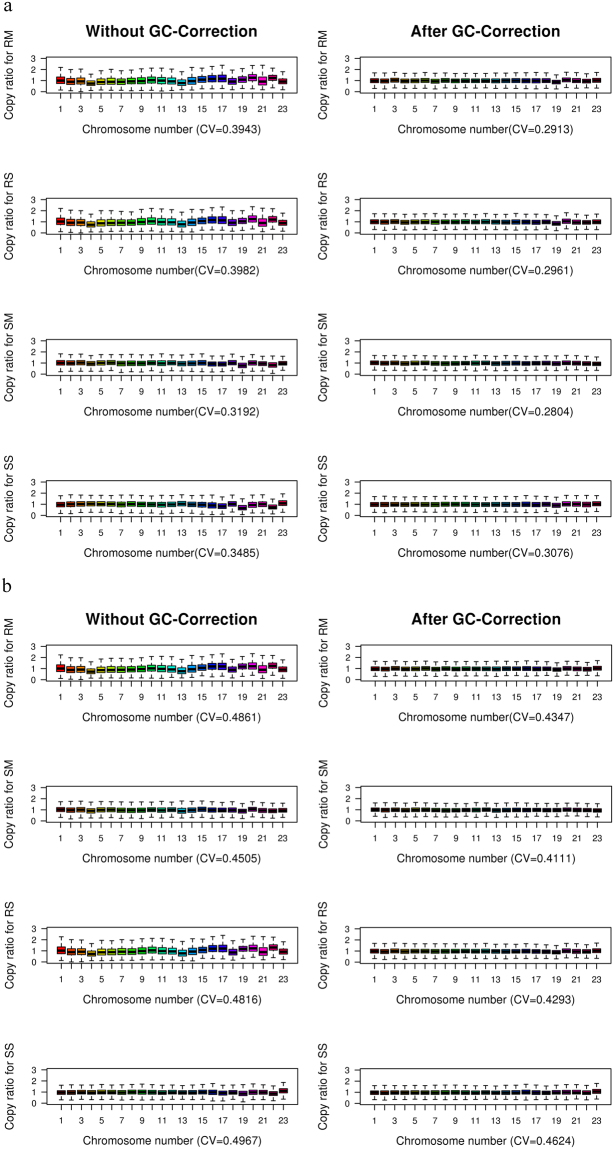
Figure 4.
Distribution of NDR values for the four combinations across the whole genome on HiSeq2000 (a) and Proton (b) platforms. Box plot represents NDR values in 124,011 windows for the same sample. x-axis is Chromosome number; y-axis is NDR values. The left and right represent the comparison without GC-correction and after GC-correction, respectively, for the same combination. The CV is the coefficient of variation of NDR across the whole genome. RS, RM, SS, SM are four combinations. RS is short for Rubicon PicoPLEX WGA Kit and single cell, RM is short for Rubicon PicoPLEX WGA Kit and multiple cells, SS is short for Sigma-Aldrich WGA4 kit and single cell, SM is short for Sigma-Aldrich WGA4 kit and multiple cells.

