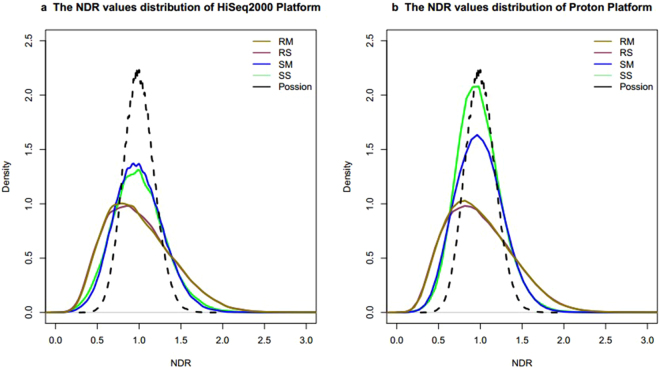
Figure 6.
Overview of the NDR value distribution for the four combinations. The NDR value is defined as the number of reads in each window to the mean number of reads in autosomal windows. The dashed curve is plotted using the simulated data (124,011 dots), which conformed to the Poisson distribution (λ = 30) and was normalized by dividing by 30. RS, RM, SS, SM are four combinations. RS is short for Rubicon PicoPLEX WGA Kit and single cell, RM is short for Rubicon PicoPLEX WGA Kit and multiple cells, SS is short for Sigma-Aldrich WGA4 kit and single cell, SM is short for Sigma-Aldrich WGA4 kit and multiple cells.

