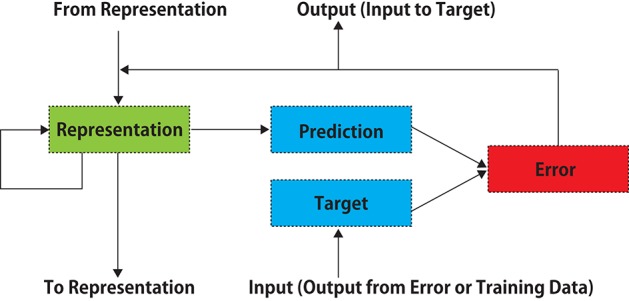
Figure 1.

A schematic diagram of PredNet (a modification of Figure 1 in Lotter et al., 2016). Illustration of information flow within a single layer is presented. Vertical arrows represent connections with other layers. Each layer consists of “Representation” neurons, which output a layer-specific “Prediction” at each time step, which is subtracted from “Target” to produce an error, which is then propagated laterally and vertically in the network. External data or a lower-layer error signal is input to “Target.” In each layer, the input information is not processed directly, and the prediction error signal is processed.
