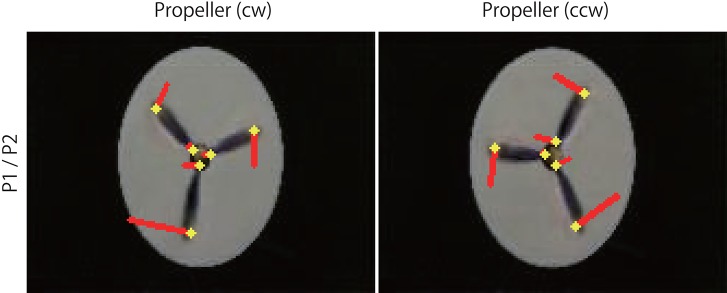
Figure 7.
Optical flow vectors detected in the rotating propellers. The vectors were obtained between a pair of the first/second consecutive predictive images (P1/P2) of the rotating propellers. Red bars denote the direction and magnitude of vectors, yellow dots denote the start points of the vectors. To aid visualization, the magnitude of the vectors was amplified 30 times. The vectors were written over the P2 images (width 160, height 120 pixels). A network trained with 500 K video frames was used for prediction.

