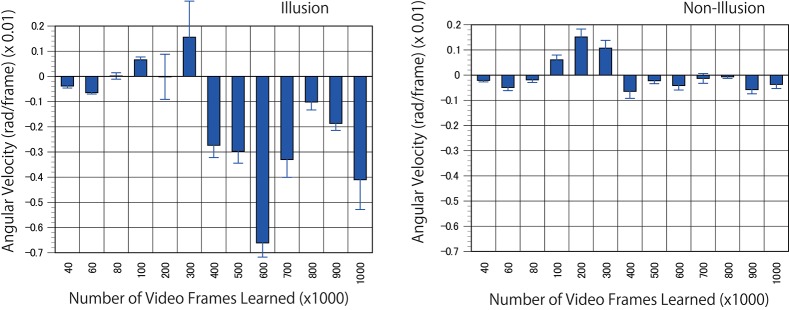
Figure 8.
Predicted motion found in the illusion. Optical flow vectors detected between a pair of consecutive predictive images (P1/P2) of the illusion. The mean angular velocity was calculated from the optical flow vectors. A positive sign was assigned to clockwise rotation. One hundred optical flow vectors were detected in each pair of images. Error bars indicate standard errors. Although the reason was unknown, unidirectional optical flows were observed in a wide area of the predicted images from 100 to 300 K. The magnitude of optical flows was biased by location. The apparent positive angular velocities from 100 to 300 K appeared to be caused by the bias.

