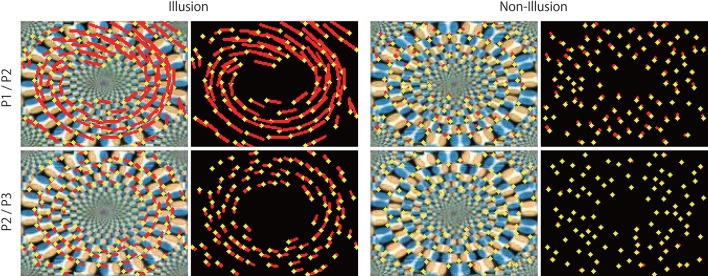
Figure 9.
Optical flow vectors detected in the illusion. Optical flow vectors detected between a pair of consecutive predictive images (P1/P2 or P2/P3) of the illusion. The magnitude of the vectors was amplified 60 times. The left is a single ring of the rotating snake illusion, and the right is a negative control image. The vectors were imposed over the P2 or P3 images or black background (width 160, height 120 pixels). A network trained with 500 K video frames was used for prediction.

