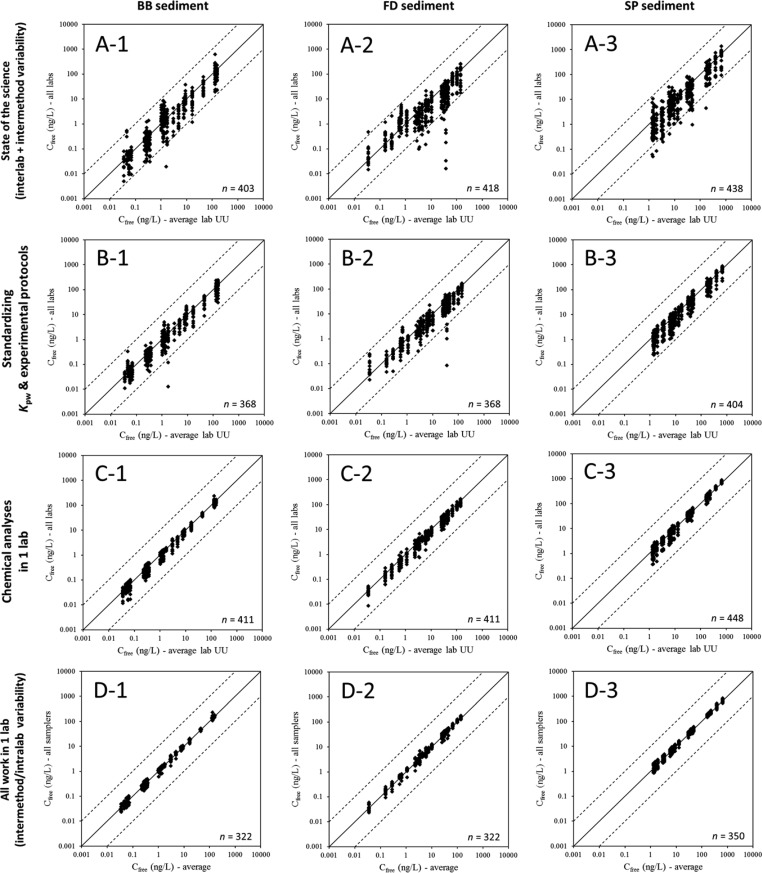
Figure 1.
Variability in freely dissolved concentrations (Cfree) determined in three sediments as measured with passive sampling methods (A) when the participants of the interlaboratory comparison followed their own protocols, (B) after standardization of Kpws and experimental protocols, (C) when, in addition to B, all chemical analyses were performed in one laboratory, and (D) when both experiments and analyses with all samplers were performed in one laboratory. Solid lines represent the 1:1 relationships; dashed lines indicate ± a factor of 10. The n number in each plot indicates the number of data points.

