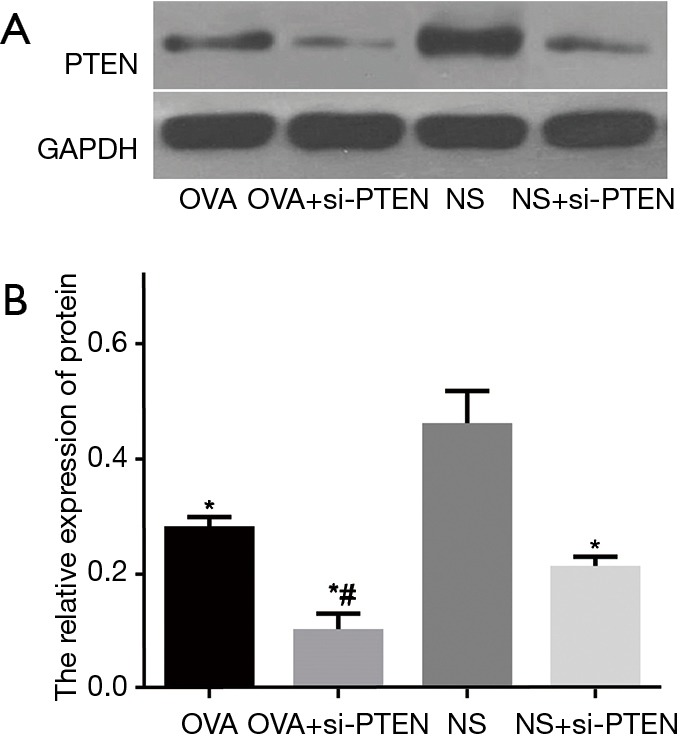
Figure 3.

Protein expression of PTEN in airway smooth muscle cells of mice in each group. (A) Gray value of PTEN protein; (B) relative protein expression of PTEN. *, compared to the NS group, P<0.05; #, compared to the OVA group, P<0.05. OVA, ovalbumin; si, small interference RNA; PTEN, phosphatase and tensin homolog; NS, normal saline.
