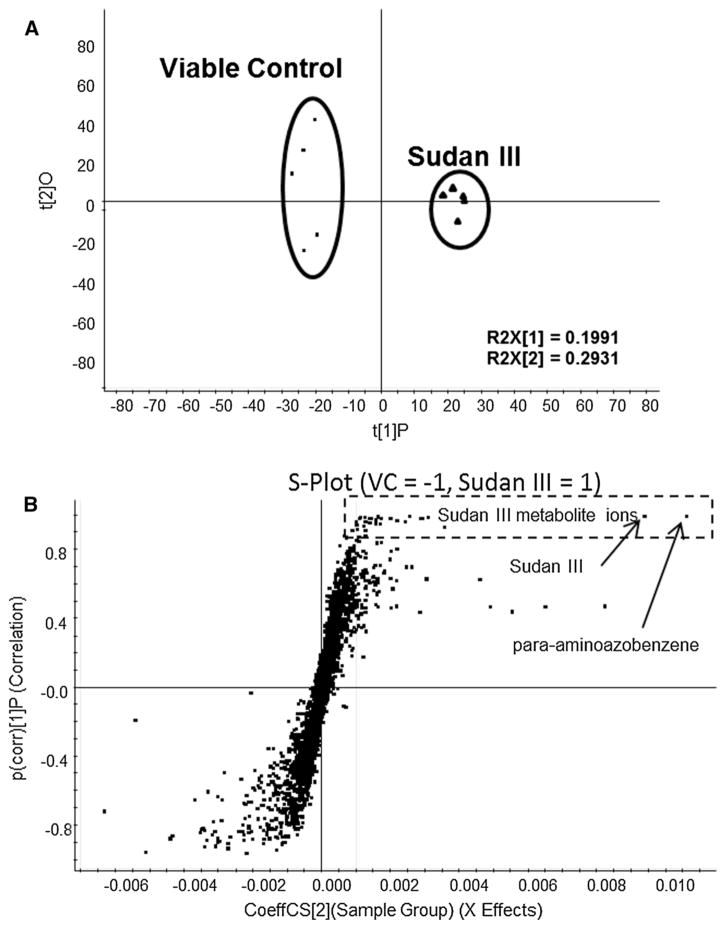
Fig. 2.
The scores plot (a) and S-plot (b) from PLS-DA analysis of LC/MS data in positive ionization mode from cell extracts after treatment with DMSO (viable control) and 10 μg/ml Sudan III, incubated at 37 °C for 18 h without agitation. Five replicates were included in control and Sudan III treated groups, respectively. The Sudan III-related metabolites were located in the rectangle with dotted lines, and major metabolite ions were labeled

