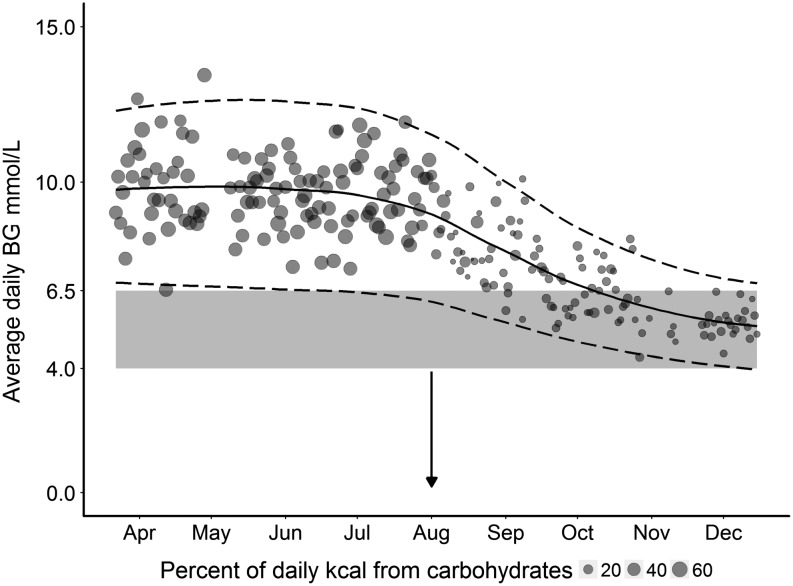
Figure 1.
Average daily BG readings with standard deviation (s.d.) over 9 months, showing the percentage of carbohydrates of total daily kcal intake. The x axis depicts the timeframe of the study and the y axis the blood glucose readings in mmol/L. Average daily BG readings are plotted as circles, with a larger circle representing a proportionally larger percentage of carbohydrate intake (of total kcal) for that day. The mean and s.d. for the data are indicated by solid and dashed lines respectively. The lower greyed area shows an ideal target BG range of 4–6.5 mmol.

 This work is licensed under a