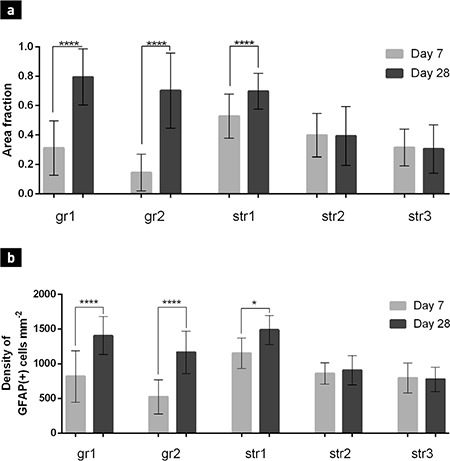
Figure 4. Dynamics of the immunopositive area (a) and cell density (b) in transplanted animals between day 7 and day 28 after transplantation. Data are presented as mean values ± standart deviation (*p<0.05; ****p<0.0001). str: striatum; GFAP: glial fibrillary acidic protein.

