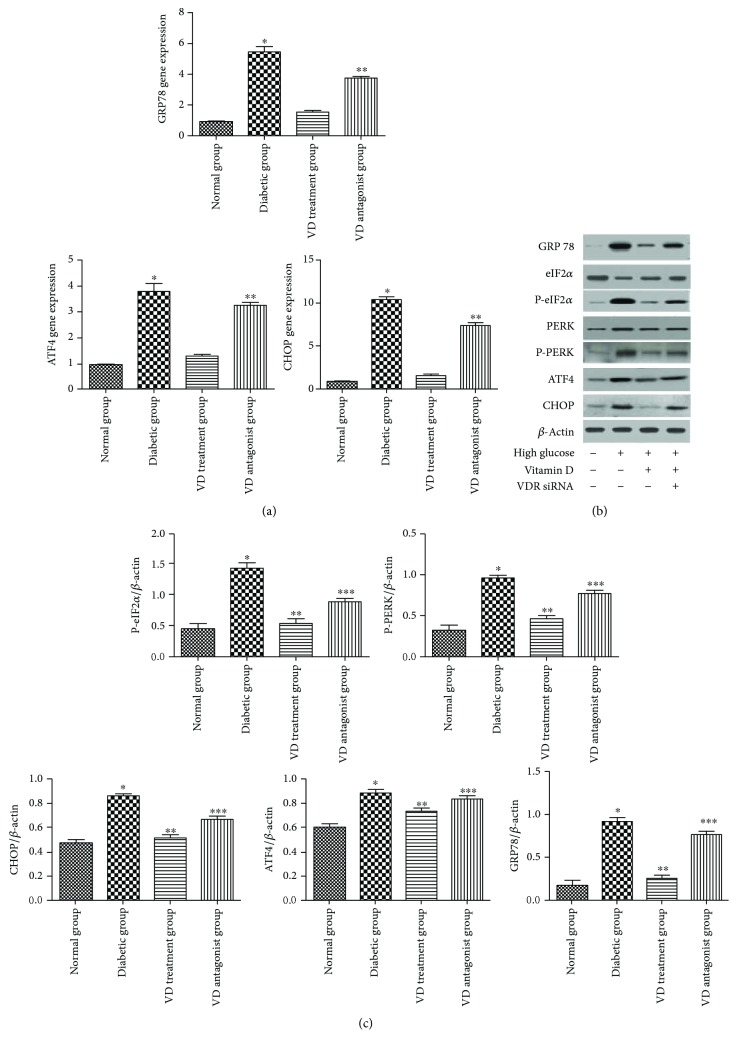
Figure 4.
Effect of vitamin D on endoplasmic reticulum stress. (a) mRNA levels of GRP78, ATF4, and CHOP. ∗p < 0.05, relative to the VD treatment group. ∗∗p < 0.05 relative to the VD treatment group. (b, c) Protein levels of GRP78, PERK, P-PERK, eIF-α, P-eIF-α, ATF4, and CHOP. Expression is presented as percentage. ∗p < 0.05, relative to the normal group. ∗∗p < 0.05, relative to the diabetic group. ∗∗∗p < 0.05, relative to the VD treatment group.

