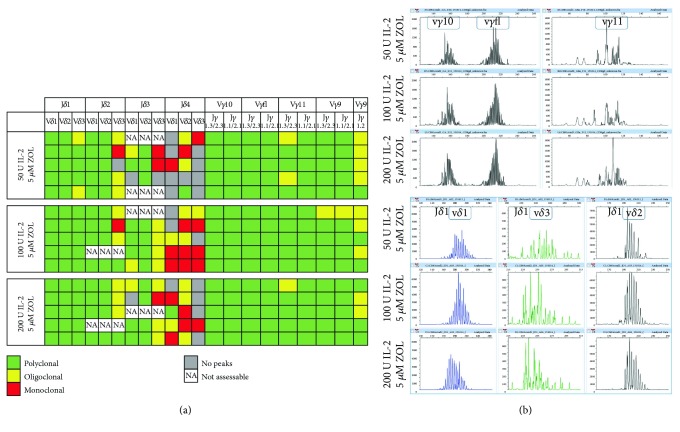
Figure 4.
Spectratyping results. TCR repertoire of the cultured γδ T cells. Spectratyping results with the expression of γ and δ chains in the TCR of the expanded γδ T cells are displayed, with regard to the clonality of each subfamily, for the postculture sample, in (a). Each row displays the results for one cultured umbilical cord blood unit. Polyclonal populations were defined as having >6 peaks (green squares), oligoclonal populations had 3–6 peaks (yellow squares), and monoclonal populations were defined as having <3 peaks (red squares). Grey squares indicate that no peaks were detected for that subfamily. NA, an abbreviation of not assessable, indicates that data could not be obtained due to technical reasons, such as insufficient DNA material in the test. In (b), representative examples of data analyzed with the peak scanner software is displayed for the Vγ10 Jγ1.3/2.3, Vγfl Jγ1.3/2.3, Vγ11 Jγ1.3/2.3, and Vδ1 Jδ1, Vδ3 Jδ1, and Vδ2 Jδ1 subfamilies.IL-2: interleukin 2; ZOL: zoledronate.

