Figure 5.
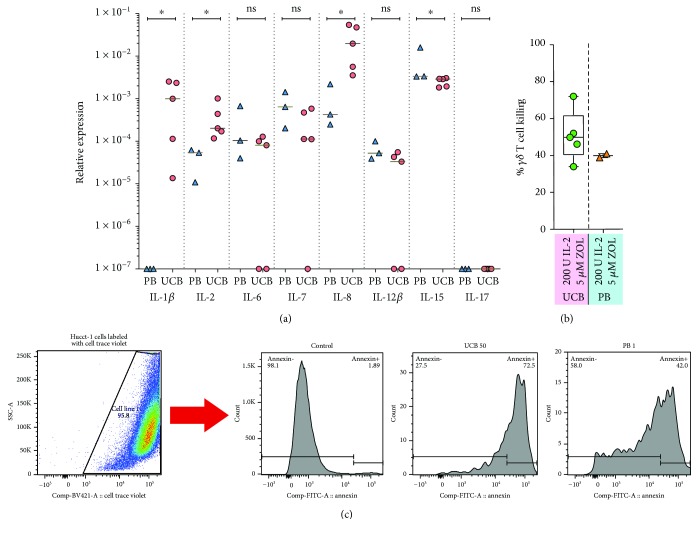
γδ T cell cytokine production and cytotoxicity. The results of real-time PCR analysis of the gene expression for the cytokines IL-1, IL-2, IL-6, IL-7, IL-8, IL-12, IL-15, and IL-17 in UCB and PB γδ T cells cultured with 5 μM zoledronate and 200 IU IL-2/ml medium displayed in (a). In (b) and (c), the results of a cytotoxicity assay based on coculture of Celltrace Violet®- (CTV-) labeled cholangiocarcinoma cells from the Hucct-1 cell line and thawed UCB and PB γδ T cells previously cryopreserved after culture with 5 μM zoledronate and 200 IU IL-2/ml medium. (b) displays the results for all tested units, and (c) shows representative FACS plots of the gating strategy for CTV-labeled tumor cells (left) and histogram plots of annexin V+ gated cells from a control culture (no γδ T cells added), and from cocultures with UCB and PB γδ T cells, respectively (three plots to the right). ∗ p < 0.05.

