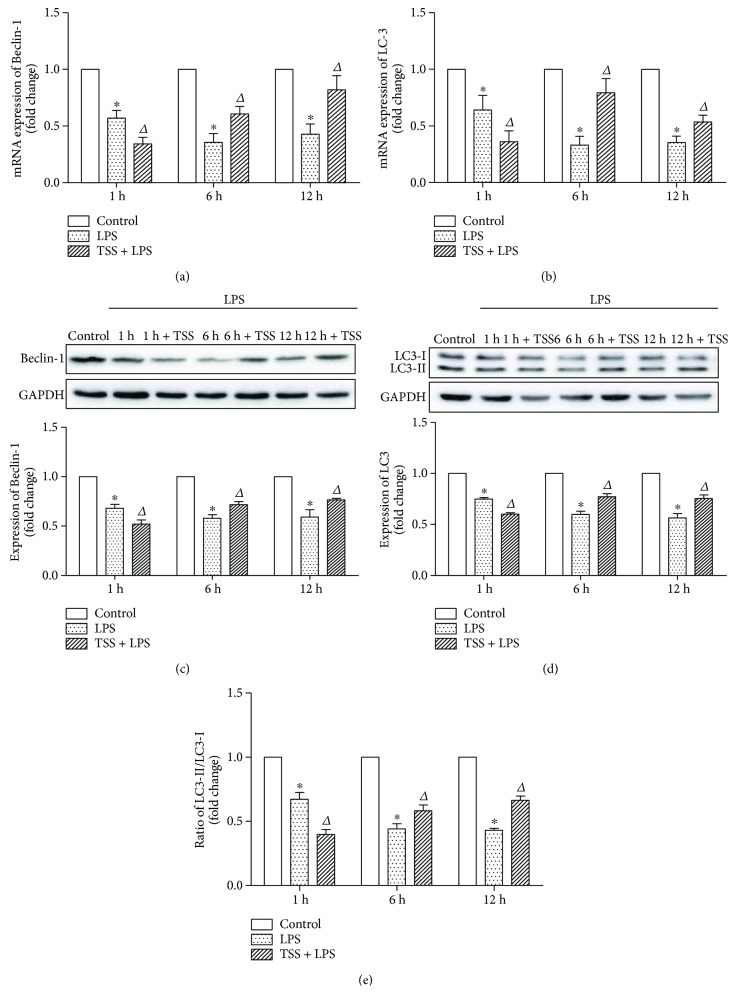
Figure 5.
Expression of autophagic markers Beclin-1 and LC3. (a) mRNA expression of Beclin-1 in each group. (b) mRNA expression of LC3 in each group. (c) Protein expression of Beclin-1 in each group; the upper part is the representative blots of Beclin-1 and GAPDH; the lower part is the densitometric analysis of Beclin-1 expression normalized to GAPDH. (d) Protein expression of LC3 in each group. The upper part is the representative blots of LC3; the lower part is the densitometric analysis of LC3 expression normalized to GAPDH. (e) Ratio of LC3-II to LC3-I in each group. LPS: lipopolysaccharide; TSS: tanshinone IIA sodium sulfonate. Blank column indicates control group; dot column indicates LPS treatment at all observed time points; diagonal column indicates TSS pretreatment at all observed time points; n = 10 in each group. Each bar presents the mean ± SEM. ∗P < 0.05 versus control group. ΔP < 0.05 versus LPS group.

