
Fig. 2.
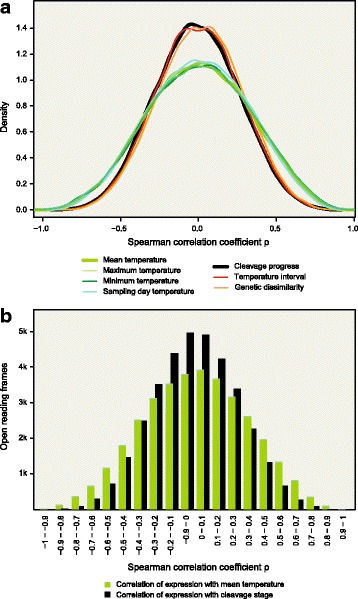
The expression of maternally contributed RNAs correlates with maternally experienced mean, maximum, and minimum temperature, but not with control parameters. a, Density plot of the Spearman correlation coefficients calculated between expression level and indicated parameters. b, Barplot showing the number of open reading frames that correlate with mean temperature experienced by the mother before oviposition (green) or with cleavage stage (black) at the indicated correlation values