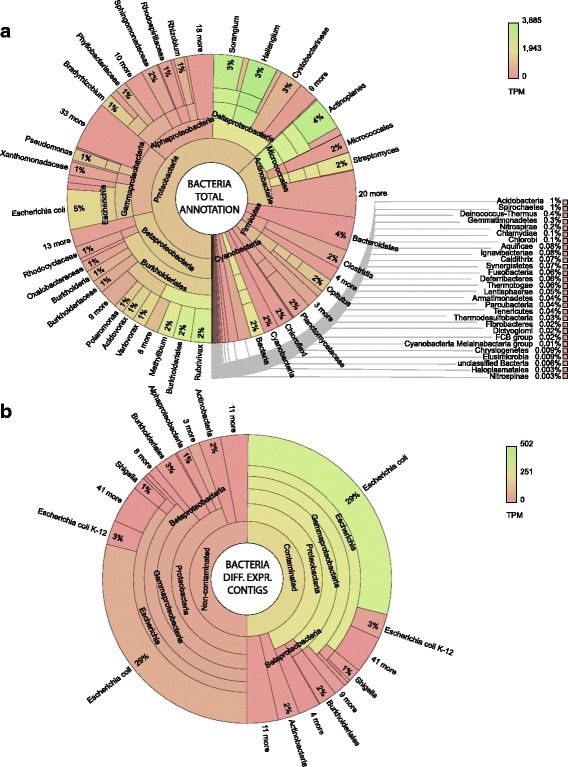
Fig. 6.

Bacterial contigs, total and differentially expressed (DE) transcript origin. Krona graphs [47] represent a total annotation of bacterial transcripts (including non-DE) and b annotation of DE bacterial transcripts. The proportion of each taxonomic grouping is defined by the number of unique transcripts, whereas the colour represents the relative abundance (transcripts per million tpm) of transcripts in each taxon. A full contig list including expression data, functional description (if available), gene ontology terms (if available) and secondary annotation (if available) is provided in Additional file 4. A list of bacterial DE transcripts (including protein coding sequences within polycistronic contigs annotated with transdecoder is provided in Additional file 10. Interactive versions of these Krona graphs available at: https://github.com/gonzalezem/Tripartite_Metatranscriptomics_article
