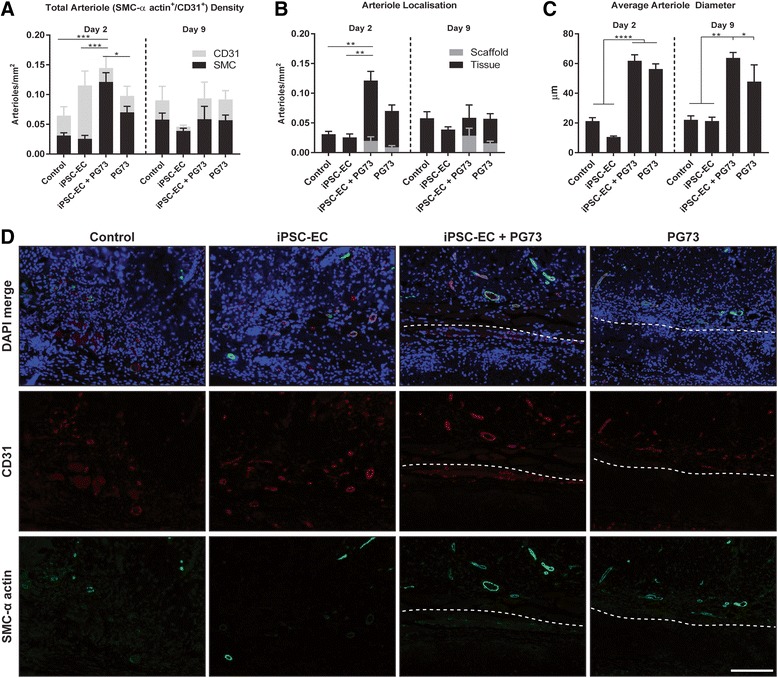
Fig. 5.

a Functional angiogenesis quantification of arteriole density (vessels double stained for CD31+ and SMC-α actin+). *p < 0.05, ***p < 0.001. n = 5 samples/group. b Quantification of arteriole location in surrounding tissue vs inside scaffold. **p < 0.01. n = 5 samples/group. c Quantification of average arteriole diameter. ***p < 0.001, **p < 0.01, *p < 0.05. n = 5 samples/group. d Representative photographs of DAPI/CD31/SMC-α actin merge, CD31, and SMC-α actin, respectively, at the wound site or tissue implant interface (dotted lines: above represents tissue, below represents scaffold) at day 2, scale bar represents 100 μm. SMC-α smooth muscle cell-actin, CD31 cluster of differentiation 31 (endothelial marker), PG73 polycaprolactone/gelatin (70:30 ratio), iPSC-EC induced pluripotent stem cell-derived endothelial cell, DAPI 4',6-diamidino-2-phenylindole
