Fig. 2.

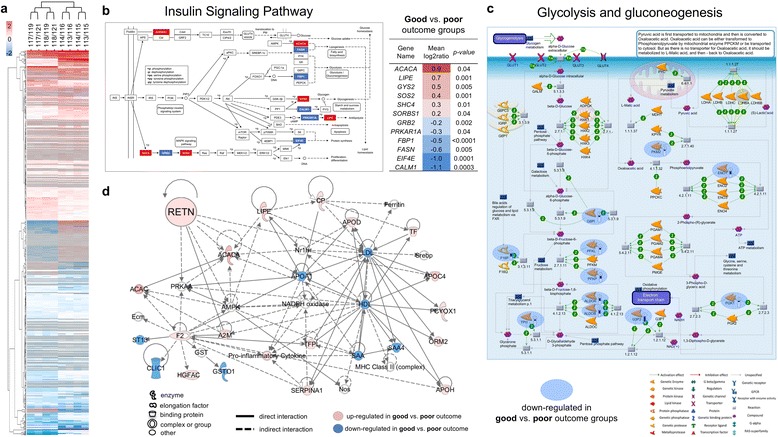
a Hierarchical clustering analysis of all differentially expressed proteins (DEPs) (812 proteins at p ≤ 0.05 with ≥ 2 unique peptides). b Insulin signalling pathway significantly over-represented in DEPs between good and poor outcome groups (Fisher exact p = 0.015) using KEGG Pathway analysis with DAVID. Tabulation of gene names of the observed differentially expressed proteins constituent to the pathway presented. c MetaCore showed that glycolysis/gluconeogenesis was a significantly enriched process in the DEPs between good and poor outcome groups (FDR corrected p = 0.011). d Network analysis of differentially expressed proteins using Ingenuity Pathway Analysis showed participation of resistin in the small molecule biochemistry network (score = 23; focus molecules = 20)
