
Fig. 4.
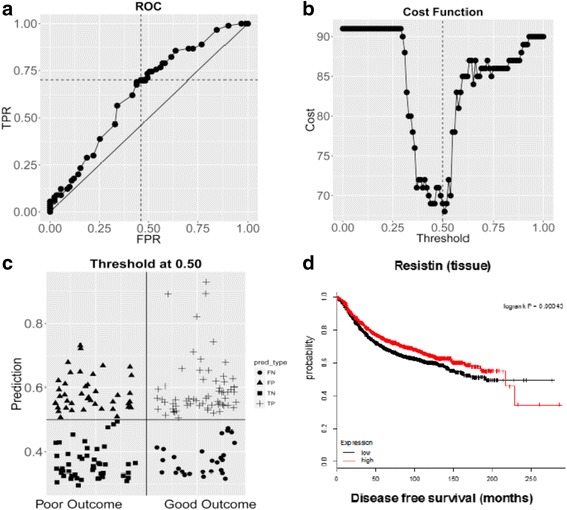
a Receiver operating characteristic (ROC) curve of the true positive rate (TPR) versus the false positive rate (FPR) with AUC = 0.6352. b Cost function with equivalent penalties for false negatives and false positives. c Distribution plot of 30 false negatives (FN), 33 false positives (FP), 58 true negatives (TN) and 60 true positives (TP). d In-silico Kaplan–Meier survival analysis of resistin expression at the tissue level