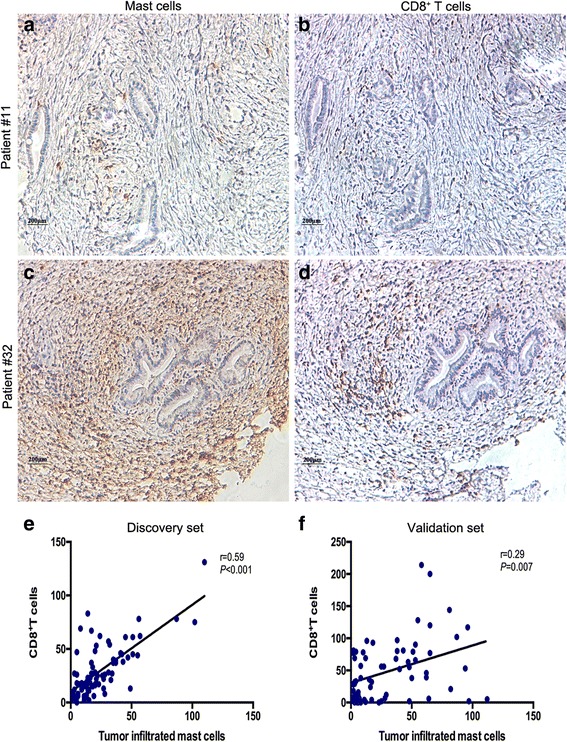
Fig. 3.

The relationships between TIMs and CD8+ T cells in BTC patients. (a-d) serial sections from GBC and EBDC samples immunohistochemically stained for TIMs and CD8+ T cells. Scale bar: 200 μm (original magnification 200×). (e, f) Spearman’s correlation for TIMs and CD8+ T cells in the discovery set and validation set
