. 2017 Oct 16;8(12):8384–8399. doi: 10.1039/c7sc03336b

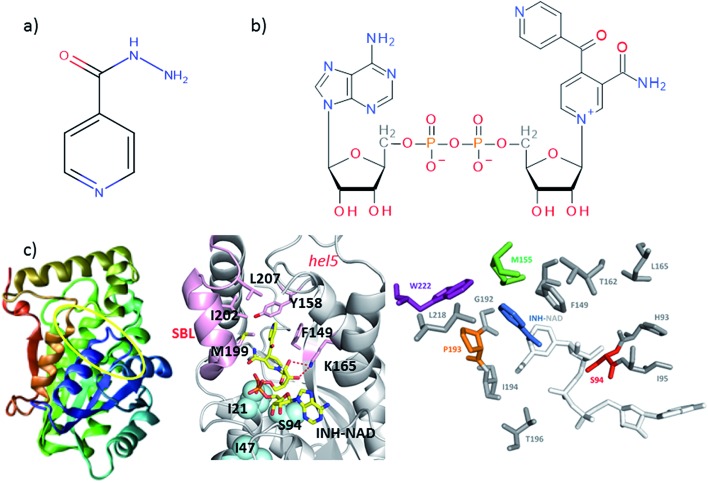
Fig. 1. Molecular structures of (a) isoniazid (INH) and (b) the adduct molecule formed between INH and NAD that is an inhibitor of InhA.4,5 (c) Left, crystal structure of InhA (PDB ; 1zid),5 the color scheme runs from blue to red beginning from residue 1. The INH–NAD binding site is shown by a yellow oval. Centre diagram shows relative positions of key residues within the INH–NAD binding site. Residues clinically-implicated in resistance are shown using ball representations, other key residues referred to in the text are shown using a stick representation. Carbon atoms in the INH–NAD adduct are shown in yellow; nitrogen in blue; phosphorous in orange and oxygen in red. Right, relative spatial positions of mutated residues studied in this work to the INH–NAD adduct. S94 is shown in red, W222 in purple, P193 in orange. The NAD body of the inhibitor is shown in white, the INH-related portion is shown in blue.

Fig. 1