. 2017 Oct 16;8(12):8384–8399. doi: 10.1039/c7sc03336b

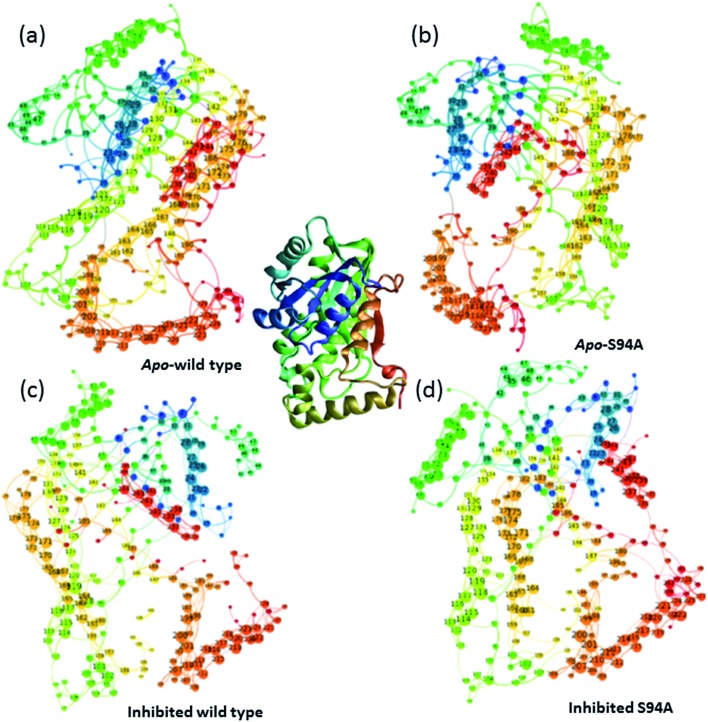
Fig. 7. Network graphs depicting the one-quantum exciton Hamiltonian inter–residue couplings. (a) apo wild-type without inhibitor (PDB: 2aq8 (ref. 10)); (b) apo S94A mutant without inhibitor (PDB: ; 4dti11); (c) wild-type with inhibitor (PDB: ; 1zid5); (d) S94A mutant with inhibitor (PDB: ; 2nv6 (ref. 7)). The crystal structure (PDB: ; 1zid5) is shown as a ribbon diagram in the centre for comparison; the colours of residues are consistent across the figure but small changes in orientation of the network maps are present. Each node represents a residue; lines linking residues indicate a coupling interaction and the thickness of the line indicates the magnitude of the coupling, for further details see text.

Fig. 7