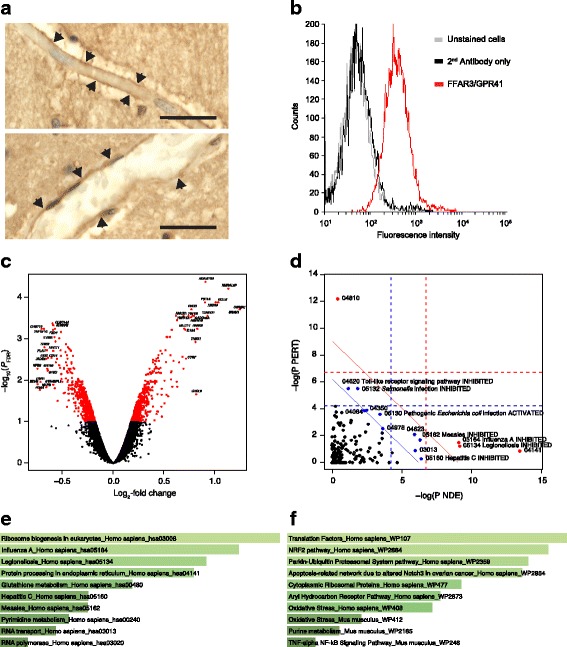
Fig. 1.

Effects on gene expression of exposure of the hCMEC/D3 cell line to propionate (1 μM, 24 h). a Representative images of FFAR3 immunoreactivity within endothelial cells of capillaries (i) and larger post-capillary (ii) blood vessels in control human brains post-mortem; scale bar 20 μm, sections are 5 μm thick; images are representative of five independent cases; areas of particular immunoreactivity are highlighted by black arrowheads. b Surface expression of FFAR3/GPR41 by hCMEC/D3 cells (grey line, unstained cells, black line secondary antibody control, red line FFAR3); data are representative of three independent experiments. c Volcano plot showing significantly (PFDR < 0.1, red dots) differentially expressed genes. The top 20 up- and downregulated genes are labelled. d SPIA evidence plot for the 1136 significantly differentially expressed genes. Only those human KEGG pathways associated with non-specific microbial infections are labelled. The pathways at the right of the red oblique line are significant (P < 0.2) after Bonferroni correction of the global P values, pG, obtained by combining the pPERT and pNDE using the normal inversion method. The pathways at the right of the blue oblique line are significant (P < 0.2) after a FDR correction of the global P values, pG. 04810. Regulation of actin cytoskeleton (inhibited); 04064, NF-kappa B signalling pathway (inhibited); 04978, mineral absorption (inhibited); 03013, RNA transport (activated); 04141, protein processing in endoplasmic reticulum (activated); 04350, TGF-beta signalling pathway (activated); 04623, cytosolic DNA-sensing pathway (inhibited). e Association of all significantly differentially expressed genes (n = 1136) with KEGG pathways, Enrichr. f Association of all significantly upregulated genes (n = 553) with WikiPathways, Enrichr. e, f The lighter the colour and the longer the bars, the more significant the result is. Significance of data was determined using rank-based ranking; only the top 10 results are shown in each case
