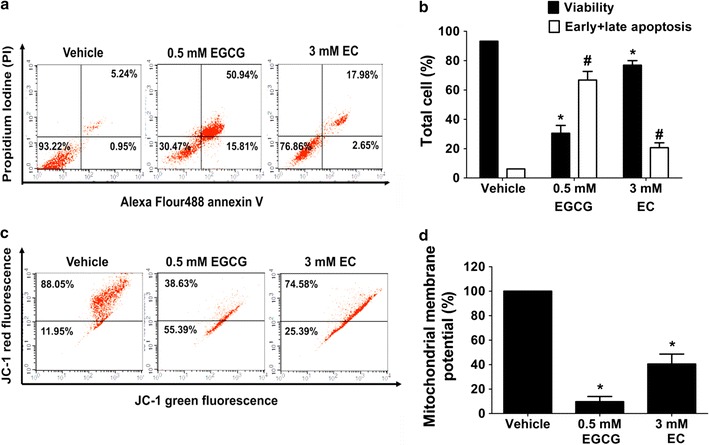
Fig. 2.

The apoptotic induction mediated by disruption of ∆Ψm with effects of EGCG and EC in HepG2 cells. Cells were treated with EGCG and EC for 72 h. Controls were incubated with 0.1% DMSO. a The population of apoptotic cells was determined by flow cytometry and depicted as representative flow cytometry scatterplots. b The histogram shows percentages of the distribution of viable and total apoptotic (early and late) cells measured by double staining of annexin-V and PI. c The ∆Ψm was investigated by JC-1 dye staining and detected by flow cytometry. d The histogram shows percentages of red and green fluorescent intensity ratios representing ∆Ψm compared with 100% of the control vehicle. Data from at least three independent triplicated experiments are presented as mean ± SD, n = 3, *p < 0.05 and #p < 0.05, denoting significant differences compared with the viable and apoptotic control groups, respectively
