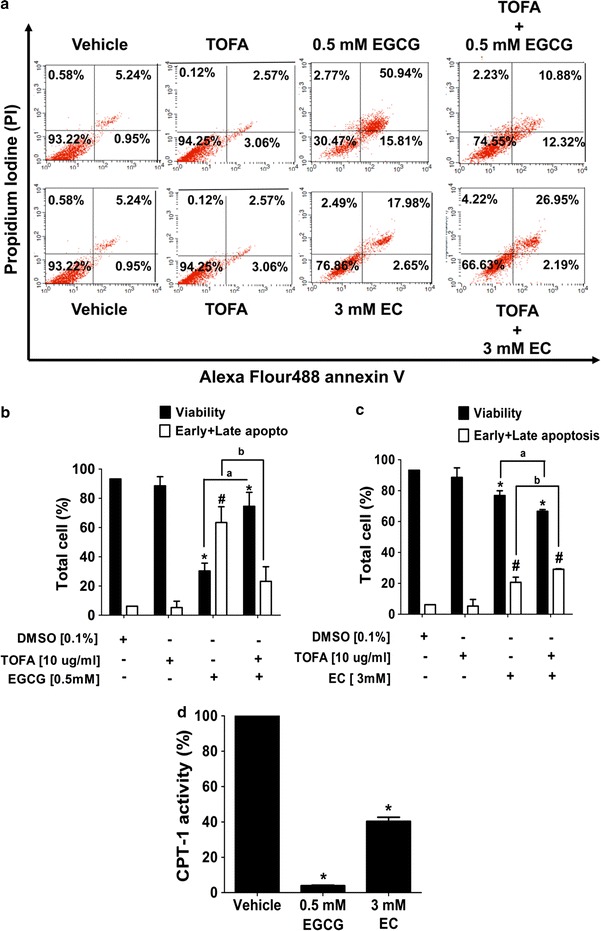
Fig. 5.

Apoptotic induction by EGCG and EC correlates with malonyl-CoA accumulation that consequently results in CPT-1 activity suppressing in HepG2 cells. Cells were treated with EGCG and EC for 72 h. TOFA at 10 µg/ml was preincubated and then cells were treated with EGCG and EC for 72 h. Control cells were treated with 0.1% DMSO. a The population of apoptotic cells was investigated by double staining of Annexin V/PI, determined by flow cytometry, and depicted as representative flow cytometry scatterplots. b, c The histogram shows percentages of cell viability and total apoptosis. d The percentages of the CPT-1 activity were measured after EGCG and EC treatment for 72 h. Data are expressed as mean ± SD from at least a triplicate of n = 3, *p and #p < 0.05, denoting significant differences compared with the viable and apoptotic control groups, respectively
