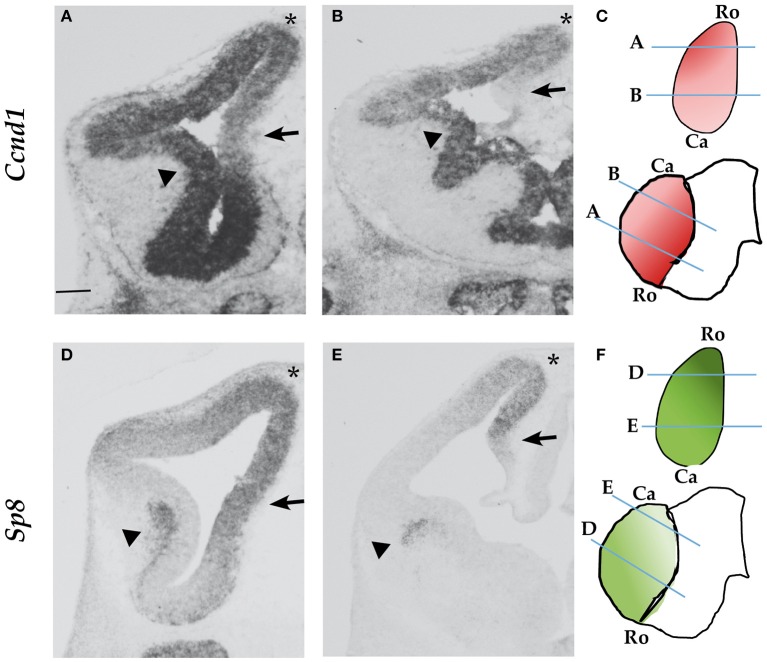
Figure 1.
Ccnd1 and Sp8 expression patterns at E12.5. ISH performed on E12.5 mouse forebrain coronal sections. Panels (A,B) show Ccnd1 mRNA expression; Panels (D,E) indicate Sp8 mRNA expression. Schematic of Ccnd1 (C) and Sp8 (F) gradients of expression are indicated along with the positions of sections shown in (A–D). Panels (A,D) represent sections at the rostral level, while Panels (B,E) represent sections at the caudal level. Arrows point to the medial pallium; arrowheads indicate the VZ (A,B) or the SVZ of the LGE (D,E). The asterisk indicates the dorsal pallium. Bar in panel (A) is 200 μm. Ro, rostral; Ca, Caudal.

