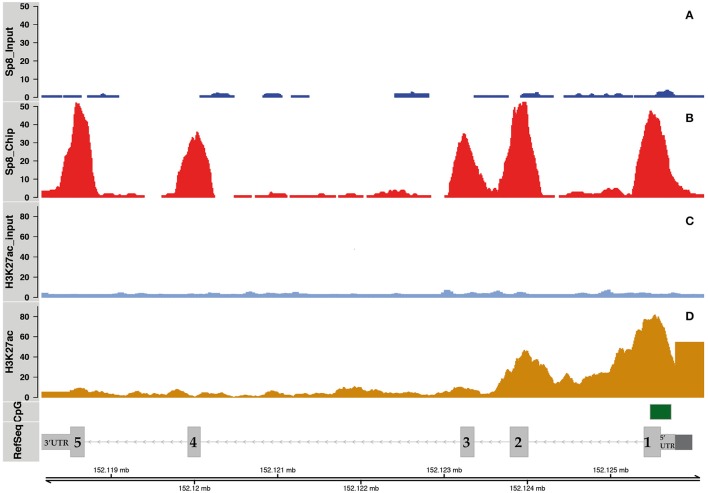
Figure 2.
SP8 binding regions on the Ccnd1 locus. Panels (A,B) show SP8 ChipSeq peaks in input and SP8 antibody (Ab) treated samples respectively. Panel (C) shows normalized H3K27ac ChipSeq peaks. Panel (D) shows Ccnd1 RefSeq gene model in light gray, the promoter (Eto, 2000) in dark gray, and the CpG islands in green. Sp8 exons are numbered and the UTRs are indicated.

