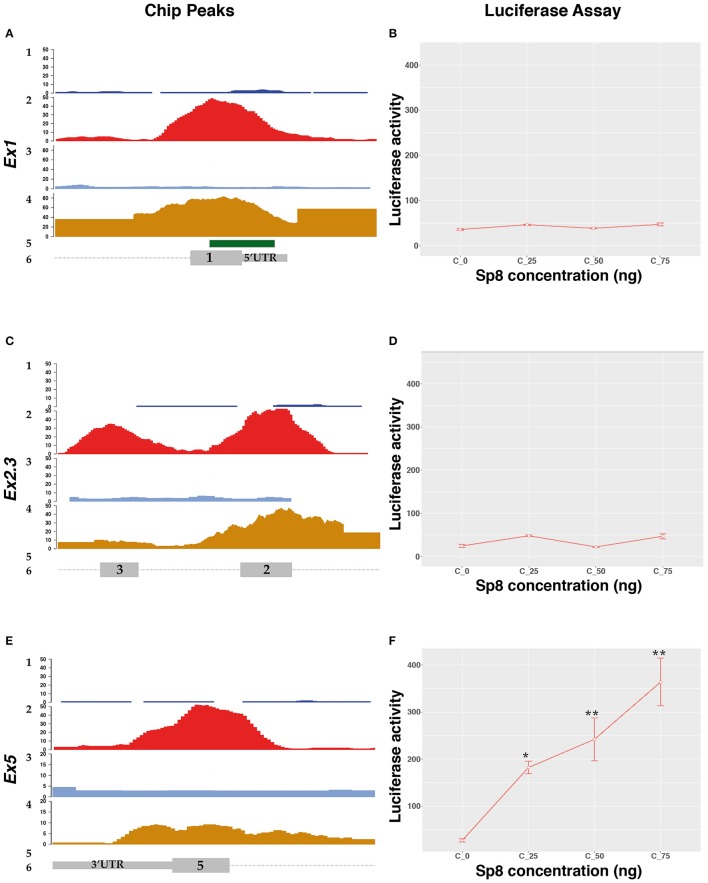
Figure 3.
SP8 transcriptional regulation of Ccnd1 genomic regions bound by Sp8. Panels (A,C,E) show details of the Ccnd1 locus where the SP8 ChipSeq peak have been detected: (A) SP8 peak at the Ccnd1 Ex1 fragment; (C) SP8 peak at the Ccnd1 Ex5 fragment; (E) Sp8 peak at the Ccnd1 Ex2.3 fragment. 1: SP8 Chip input peaks, 2: SP8 Chip peaks, 3: H3K27ac Chip Input peaks, 4: H3K27ac Chip peaks, 5: CpG island, 6: Ccnd1 RefSeq gene model. For details refer to the legend of Figure 2. Panels (B,D,F) show the results of the luciferase assays performed with Ccnd1 Ex1 (B), Ccnd1 Ex2.3 (F), and Ccnd1 Ex5 (D) fragments. Statistical significance, ANOVA: *p < 0.05, **p < 0.01.

