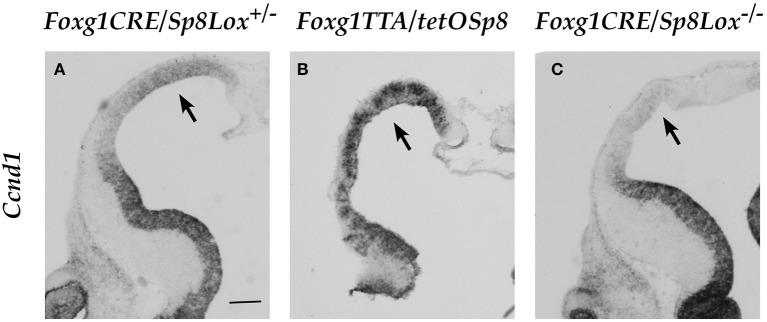
Figure 6.
Expression of Ccnd1 in embryonic forebrain after Sp8 misexpression in vivo. ISH on E12.5 mouse forebrain coronal sections. Arrow in Panel (A) shows Ccnd1 expression in the control pallial VZ. Arrows in Panels (B,C) show Ccnd1 expression in the Sp8 GOF and Sp8 LOF pallial VZ respectively. Bar in (A): 200 μm.

