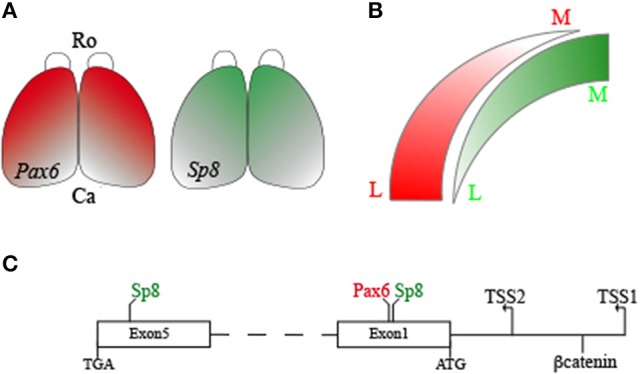
Figure 7.

Schema of the SP8, PAX6, and βcatenin interactions on the mouse Ccnd1 gene. Panel (A) shows Sp8 and Pax6 expression gradients in the developing mouse cortex. Panel (B) summarizes differences in Sp8 and Pax6 expression levels along the medio-lateral axis of the pallium. Panel (C) is a graphical representation of SP8, PAX6, and βcatenin binding positions on Ccnd1 locus. R, Rostral; C, Caudal; M, Medial; L, Lateral.
