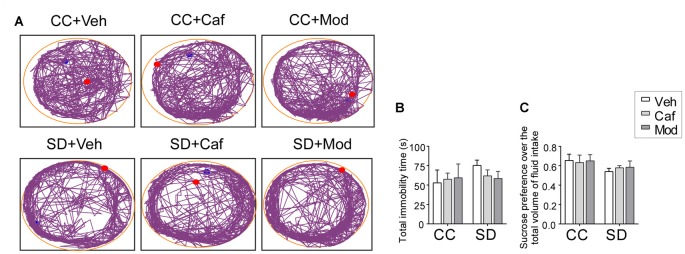
Figure 3.
Assessment of the depressive behavior following caffeine/modafinil treatment during SD. (A) Track plot of the rats during forced swim test (FST) test; (B) total immobility time; (C) sucrose preference over the total volume of fluid intake. Two way ANOVA followed by Tukey post hoc with multiple comparison test was applied for statistical comparison between groups. Blue dot represented the starting point and the red dot represented the end point of the test.

