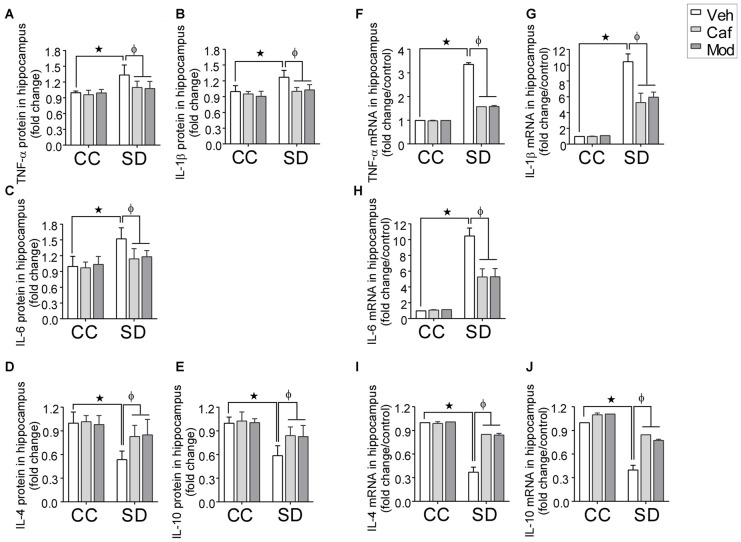
Figure 4.
Fold changes in the inflammatory cytokines in hippocampus during caffeine/modafinil administration following SD. The concentration of cytokine levels were measured in picograms per milliliter and expressed as the fold changes in TNF-α (A,F); interleukin-1β (IL-1β) (B,G); IL-6 (C,H; pro-inflammatory cytokines), IL-4 (D,I); IL-10 (E,J; anti-inflammatory cytokines) in the hippocampus. *p < 0.05 when compared to control treated with vehicle; φp < 0.05 when compared to sleep deprived treated with vehicle. Two way ANOVA followed by Tukey post hoc test with multiple comparison were used for the statistical evaluation.

