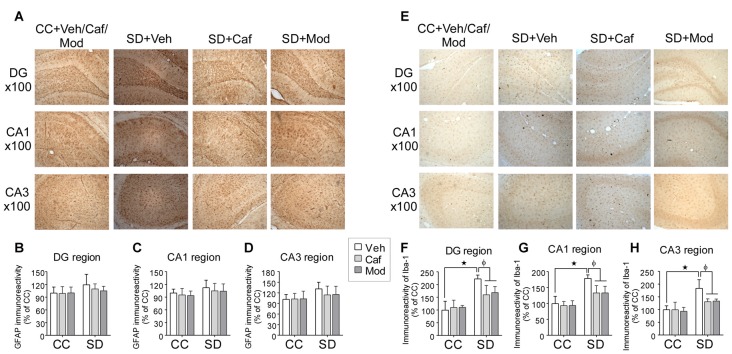
Figure 5.
Caffeine or modafinil treatment inhibited the glial cell immunoreactivity in rat hippocampus following SD. (A) Representable image of astrocytes expression in DG, CA1 and CA3 regions of the hippocampus. Glial fibrillary acidic protein (GFAP) immunoreactivity quantification in (B) DG region; (C) CA1 region; (D) CA3 region of the hippocampus. (E) Representable image of microglial cells expression in DG, CA1 and CA3 regions of the hippocampus. Ionized calcium binding adapter molecule I (Iba-1) cell immunoreactivity quantification in (F) DG region; (G) CA1 region; (H) CA3 region of the hippocampus. *p < 0.05 when compared to control treated with vehicle; φp < 0.05 when compared to sleep deprived treated with vehicle. Two way ANOVA followed by Tukey post hoc multiple comparison test was applied for statistical comparison between groups and for the graphical representation, values expressed mean percentage of Control ± SEM.

