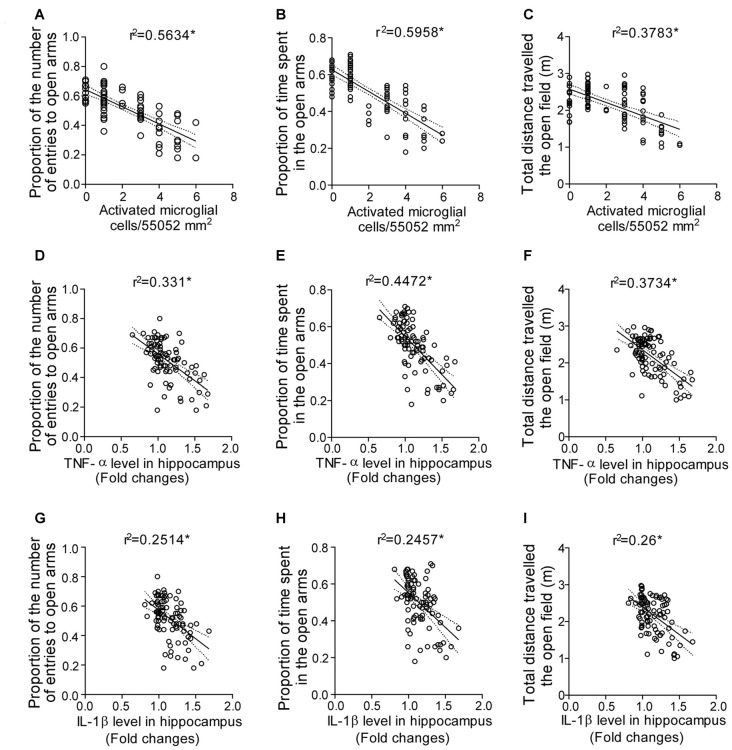
Figure 8.
Correlation analysis predicting the interaction between the anxious behavior, pro-inflammatory cytokines and activated microglia cell during SD. Interaction between the anxious behavior and activated microglial cell as shown by correlation between (A) proportion of the number of entries in the open arms and activated microglial cell count in the hippocampus; (B) proportion of the time spent in the open arms and activated microglial cell count in the hippocampus; (C) total distance traveled in the OF and activated microglial cell count in the hippocampus. Finally, the interaction between the anxious behavior and pro-inflammatory cytokine levels as shown by correlation between (D) proportion of the number of entries in the open arms and TNF-α level in hippocampus; (E) proportion of the time spent in the open arms and TNF-α level in hippocampus; (F) total distance traveled in the OF and TNF-α level in hippocampus; (G) proportion of the number of entries in the open arms and IL-1β level in hippocampus; (H) proportion of the time spent in the open arms and IL-1β level in hippocampus; (I) total distance traveled in the OF and IL-1β level in hippocampus. Pearson’s test was applied for correlation analysis. p < 0.05 was considered to be statistically significant.

