
Fig. 4.
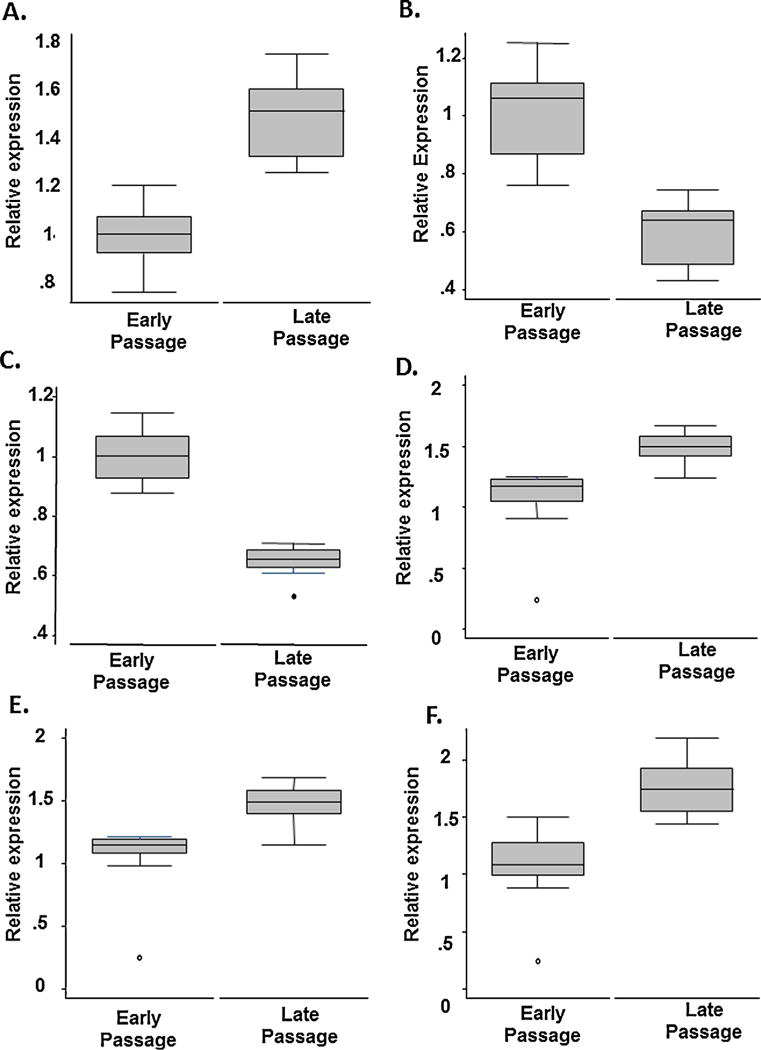
Box plots of the top 3 splicing factor gene expressions changes obtained by TaqMan low-density array (TLDA) in normal Human Dermal Fibroblasts (A–C) and Human Aortic Endothelial Cells (D–F). Gene expression levels are given relative to endogenous controls in young and old fibroblasts (passage 7 and passage 18 respectively, and in young and old endothelial cells (passage 7 and passage 13 respectively). On the Y-axis are gene expression levels relative to endogenous controls by cell passage (X-axis). Changes in the expression of PNISR (A), HNRNPA1 (B), HNRNPA2B1 (C), HNRNPUL2 (D), HNRNPK (E) and HNRNPM (F) transcripts with increasing passage are given.