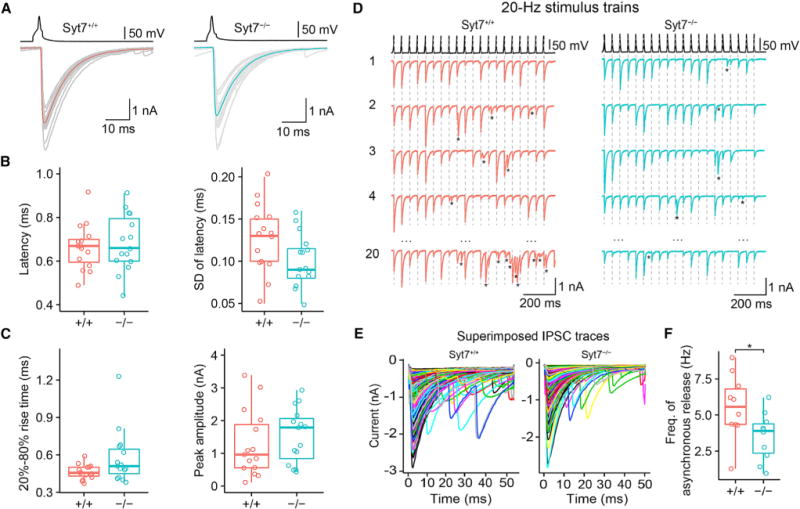
Figure 1. Syt7 Is a Ca2+ Sensor for Asynchronous, but Not Synchronous, Release at BC-PC Synapses.

(A) Evoked IPSCs in Syt7+/+ (left) and Syt7−/− (right) mice. Top, presynaptic AP evoked by short current pulses in the presynaptic BC; bottom, IPSCs recorded in the synaptically connected PC (gray traces, individual sweeps; red and cyan traces, average IPSCs).
(B and C) Boxplots of synaptic latency from the peak of the presynaptic AP to the onset of the IPSC (B, left), standard deviation of latency (B, right), 20%–80% rise time (C, left), and IPSC peak amplitude (C, right). Data from 15 pairs for Syt7+/+ and 15 pairs for Syt7−/−.
(D) Synchronous and asynchronous release during 20-Hz stimulation trains in Syt7+/+ (left) and Syt7−/− (right) mice. Asterisks represent asynchronous release events, and vertical dashed lines indicate the peaks of the presynaptic APs.
(E) Synchronous and asynchronous IPSCs during 20-Hz stimulus trains. Left, superimposed IPSCs shown at expanded timescale (aligned to the peak of the presynaptic AP at t = 0). Individual traces were color coded to enhance visibility.
(F) Boxplots of asynchronous release frequency. Asynchronous release was quantified in time intervals 15–50 ms after each presynaptic AP. The asterisk (*) indicates p = 0.034. Data from 10 pairs for Syt7+/+ and 10 pairs for Syt7−/− mice. In boxplots (B, C, and F), horizontal lines represent median; boxes, quartiles; whiskers, most extreme data points ≤ 1.5 interquartile range from box edges; and single points, data from individual experiments.
