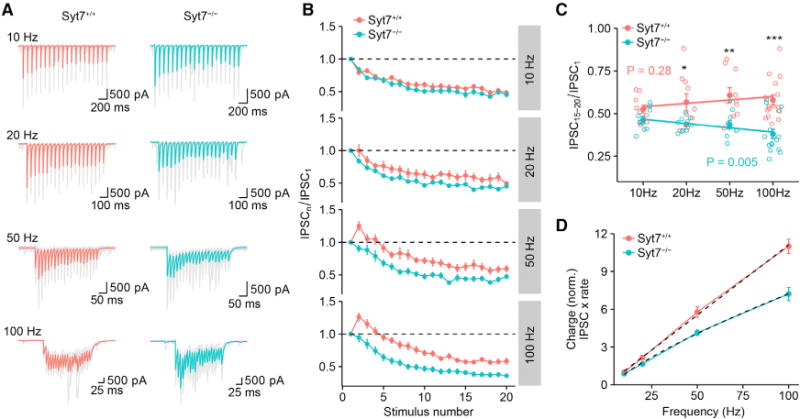
Figure 4. Syt7 Ensures Efficiency of High-Frequency Synaptic Transmission and Linearizes the Input-Output Relation of BC-PC Synapses.

(A) IPSCs evoked by trains of 20 APs at different frequencies for Syt7+/+ (left) and Syt7−/− synapses (right; gray traces, individual sweeps; red and cyan traces, average IPSCs).
(B) Normalized IPSC peak amplitudes (IPSCn/IPSC1), plotted against stimulus number (n). Red circles, Syt7+/+; cyan circles, Syt7−/−. Data were obtained from 10/10 (10 Hz), 10/10 (20 Hz), 10/10 (50 Hz), and 16/16 pairs (100 Hz).
(C) Plot of normalized steady-state IPSC amplitude, as quantified by IPSC15–20/IPSC1, against stimulus frequency. Open circles represent data from individual experiments, filled circles indicate mean ± SEM. Lines represent results from linear regression analysis (Spearman ρ = 0.16, p = 0.28 for Syt7+/+ synapses; ρ = −0.41, p = 0.005 for Syt7−/− synapses). *, **, and *** indicate p = 0.043, 0.003, and < 0.001, respectively. Note that normalized steady-state IPSC amplitude does not show significant frequency dependence in Syt7+/+ synapses but acquires marked frequency dependence in Syt7−/− synapses.
(D) Plot of normalized steady-state charge, as quantified by IPSC peak amplitude multiplied with stimulation frequency. Dashed lines represent the results from fit with a linear function (Syt7+/+) or a power function (Syt7−/−). In Syt7+/+ synapses, inhibitory charge was linearly dependent on stimulation frequency. In contrast, in Syt7−/− synapses, the dependence was sublinear.
