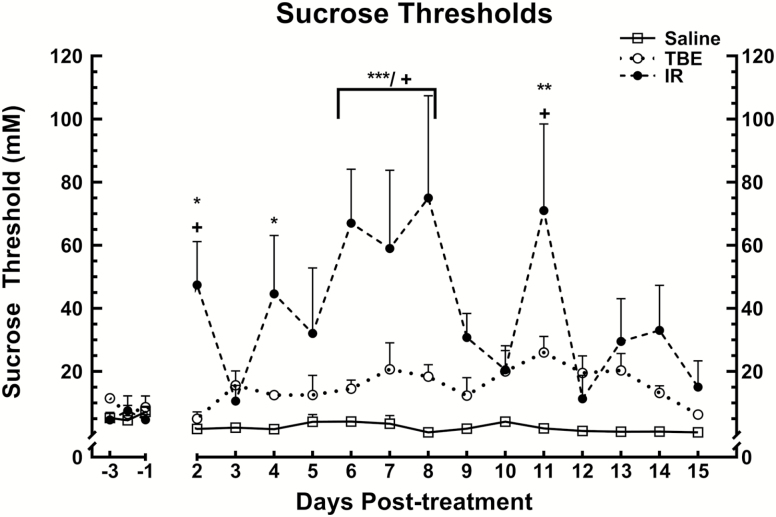
Figure 1.
Sucrose thresholds after treatment with saline, TBE or 8 Gr irradiation. The x axis represents days relative to treatment, with the day of treatment being zero. The y axis of the graph is the threshold of the mice (mM sucrose). The group of mice that received radiation treatment had significantly higher thresholds (P < 0.05) than saline controls on days 2, 4, 6, 7, 8, and 11 post-treatment. The irradiation group also had significantly higher thresholds (P < 0.05) than TBE mice on days 2, 6, 7, 8, and 11 post-treatment. There were no significant differences between the saline and anesthetic-only groups, however the anesthesia alone appeared to cause a minor, but sustained increase in thresholds. * represents significant comparisons between irradiation and saline groups, + significant comparisons between irradiation and TBE groups. * or + P < 0.05; **P < 0.01; ***P < 0.001.

