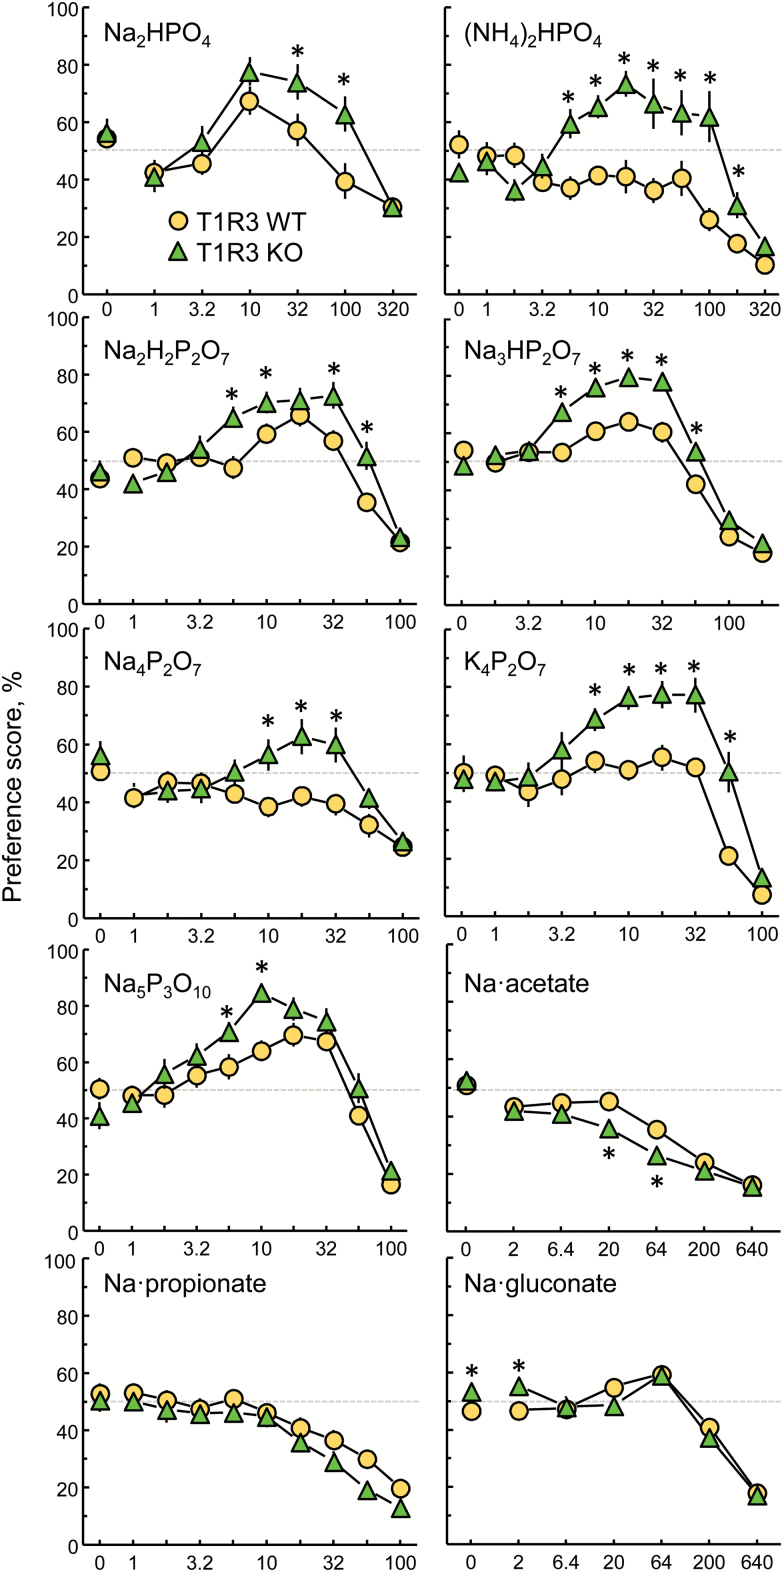
Figure 1.
Preferences of T1R3 WT and KO mice for 7 phosphorus salts and 3 large-anion sodium salts presented in 48-h 2-bottle tests with a choice between water and a taste solution. *P < 0.05 according to post hoc tests (Table 1 gives group sizes; Table 2 gives statistics). Symbols with vertical bars depict means and SEs. Most SEs were smaller than the symbols. The results with Na3HP2O7 were published previously (Tordoff et al. 2014a). SE, standard error.

