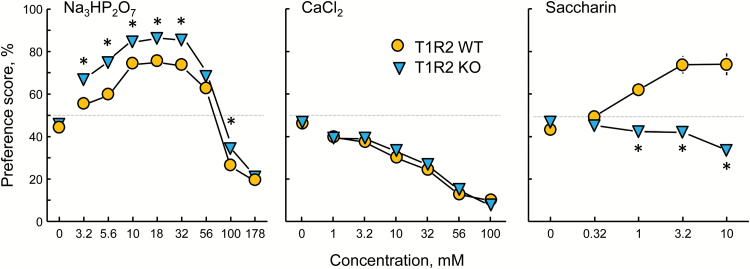
Figure 3.
Preferences of T1R2 WT and KO mice for trisodium pyrophosphate (Na3HP2O7), calcium chloride (CaCl2), and saccharin presented in 48-h 2-bottle tests with a choice between water and a taste solution. *P < 0.05 according to post hoc tests (Table 3 gives statistics). Symbols with vertical bars depict means and SEs; n = 39 WT and 46 KO.

